
BJ's has been treading water for the past six months, recording a small loss of 2.3% while holding steady at $32.49. However, the stock is beating the S&P 500’s 7.3% decline during that period.
Is there a buying opportunity in BJ's, or does it present a risk to your portfolio? Get the full stock story straight from our expert analysts, it’s free.
Even with the strong relative performance, we're cautious about BJ's. Here are three reasons why BJRI doesn't excite us and a stock we'd rather own.
Why Do We Think BJ's Will Underperform?
Founded in 1978 in California, BJ’s Restaurants (NASDAQ: BJRI) is a chain of restaurants whose menu features classic American dishes, often with a twist.
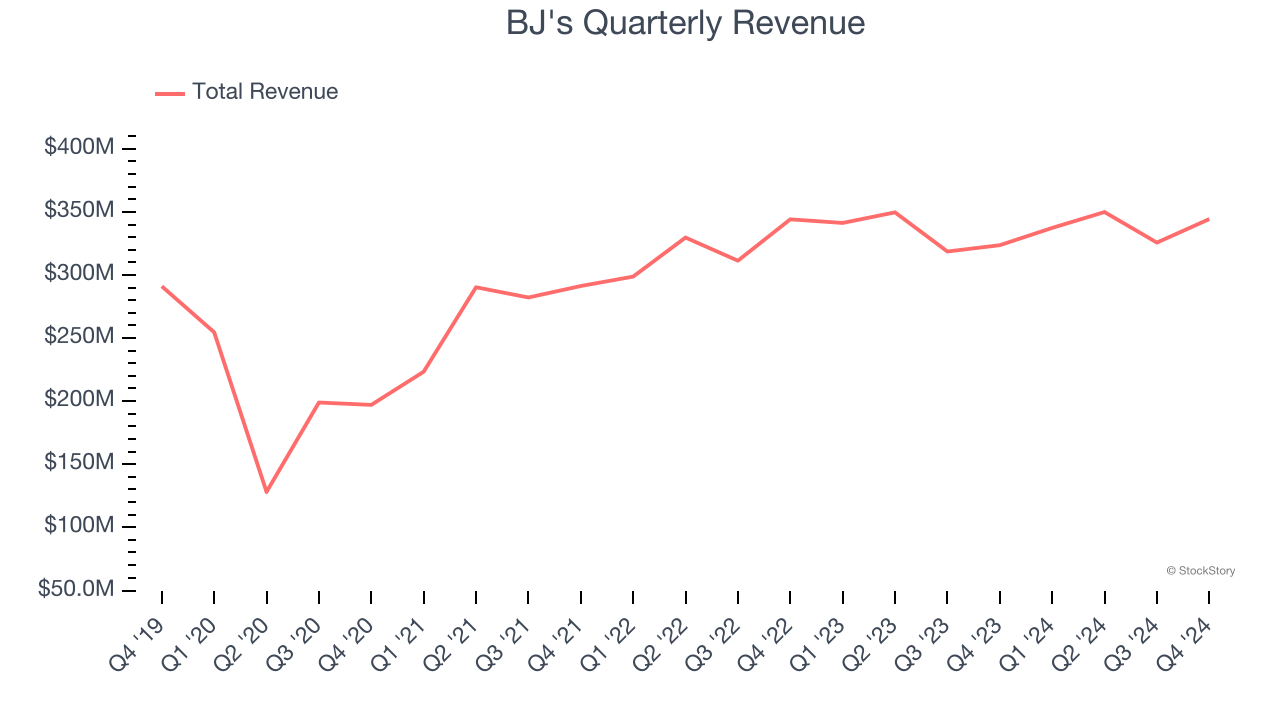
1. Long-Term Revenue Growth Disappoints
A company’s long-term performance is an indicator of its overall quality. Any business can put up a good quarter or two, but the best consistently grow over the long haul. Unfortunately, BJ’s 3.2% annualized revenue growth over the last five years was sluggish. This fell short of our benchmark for the restaurant sector.
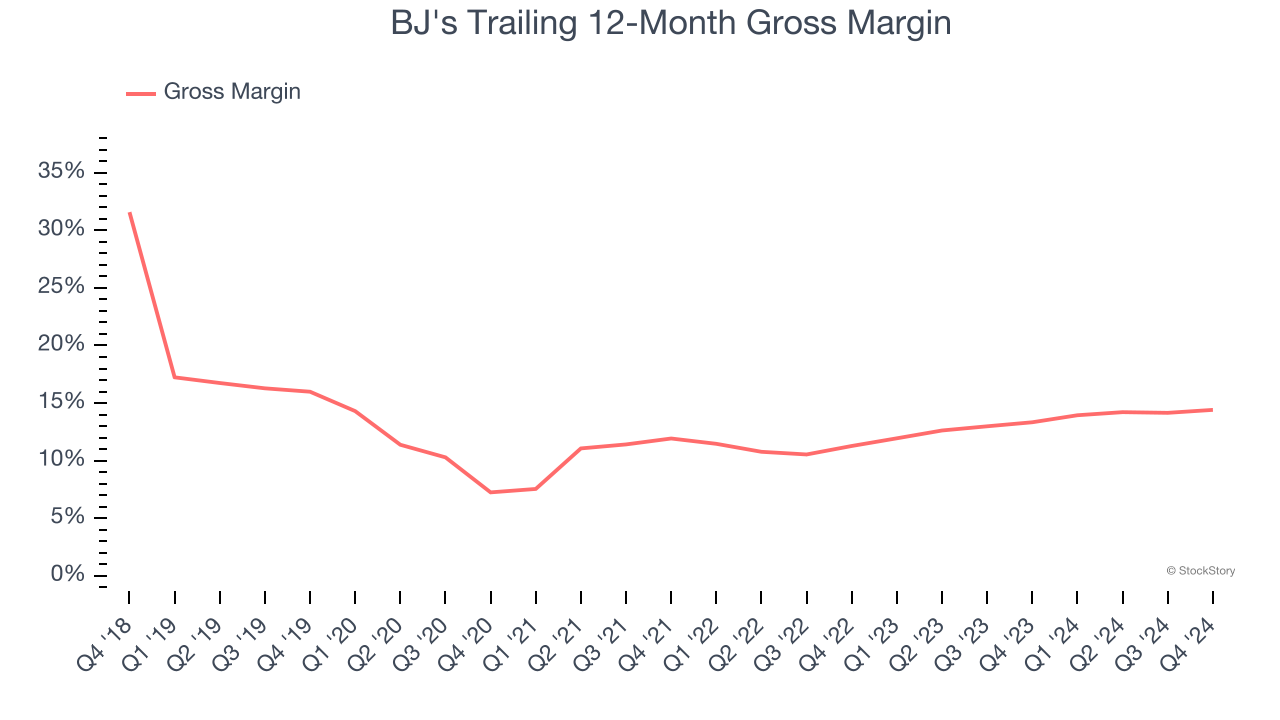
2. Low Gross Margin Reveals Weak Structural Profitability
Gross profit margins are an important measure of a restaurant’s pricing power and differentiation, whether it be the dining experience or quality and taste of food.
BJ's has bad unit economics for a restaurant company, signaling it operates in a competitive market and has little room for error if demand unexpectedly falls. As you can see below, it averaged a 13.9% gross margin over the last two years. That means BJ's paid its suppliers a lot of money ($86.12 for every $100 in revenue) to run its business.
3. Previous Growth Initiatives Haven’t Paid Off Yet
Growth gives us insight into a company’s long-term potential, but how capital-efficient was that growth? Enter ROIC, a metric showing how much operating profit a company generates relative to the money it has raised (debt and equity).
BJ’s five-year average ROIC was flat, meaning management lost money while trying to expand the business. Its returns were among the worst in the restaurant sector.
Final Judgment
We cheer for all companies serving everyday consumers, but in the case of BJ's, we’ll be cheering from the sidelines. Following its recent outperformance in a weaker market environment, the stock trades at 22.6× forward price-to-earnings (or $32.49 per share). This multiple tells us a lot of good news is priced in - we think there are better investment opportunities out there. Let us point you toward a top digital advertising platform riding the creator economy.
Stocks We Like More Than BJ's
Donald Trump’s victory in the 2024 U.S. Presidential Election sent major indices to all-time highs, but stocks have retraced as investors debate the health of the economy and the potential impact of tariffs.
While this leaves much uncertainty around 2025, a few companies are poised for long-term gains regardless of the political or macroeconomic climate, like our Top 5 Growth Stocks for this month. This is a curated list of our High Quality stocks that have generated a market-beating return of 175% over the last five years.
Stocks that made our list in 2019 include now familiar names such as Nvidia (+2,183% between December 2019 and December 2024) as well as under-the-radar businesses like Sterling Infrastructure (+1,096% five-year return). Find your next big winner with StockStory today for free.


