Since October 2024, PAR Technology has been in a holding pattern, posting a small loss of 3% while floating around $55.35.
Is now the time to buy PAR Technology, or should you be careful about including it in your portfolio? Check out our in-depth research report to see what our analysts have to say, it’s free.
We're sitting this one out for now. Here are three reasons why PAR doesn't excite us and a stock we'd rather own.
Why Is PAR Technology Not Exciting?
Originally founded in 1968 as a defense contractor for the U.S. government, PAR Technology (NYSE: PAR) provides cloud-based software, payment processing, and hardware solutions that help restaurants manage everything from point-of-sale to customer loyalty programs.
1. Revenue Growth Flatlining
We at StockStory place the most emphasis on long-term growth, but within business services, a stretched historical view may miss recent innovations or disruptive industry trends. PAR Technology’s recent performance shows its demand has slowed significantly as its revenue was flat over the last two years. 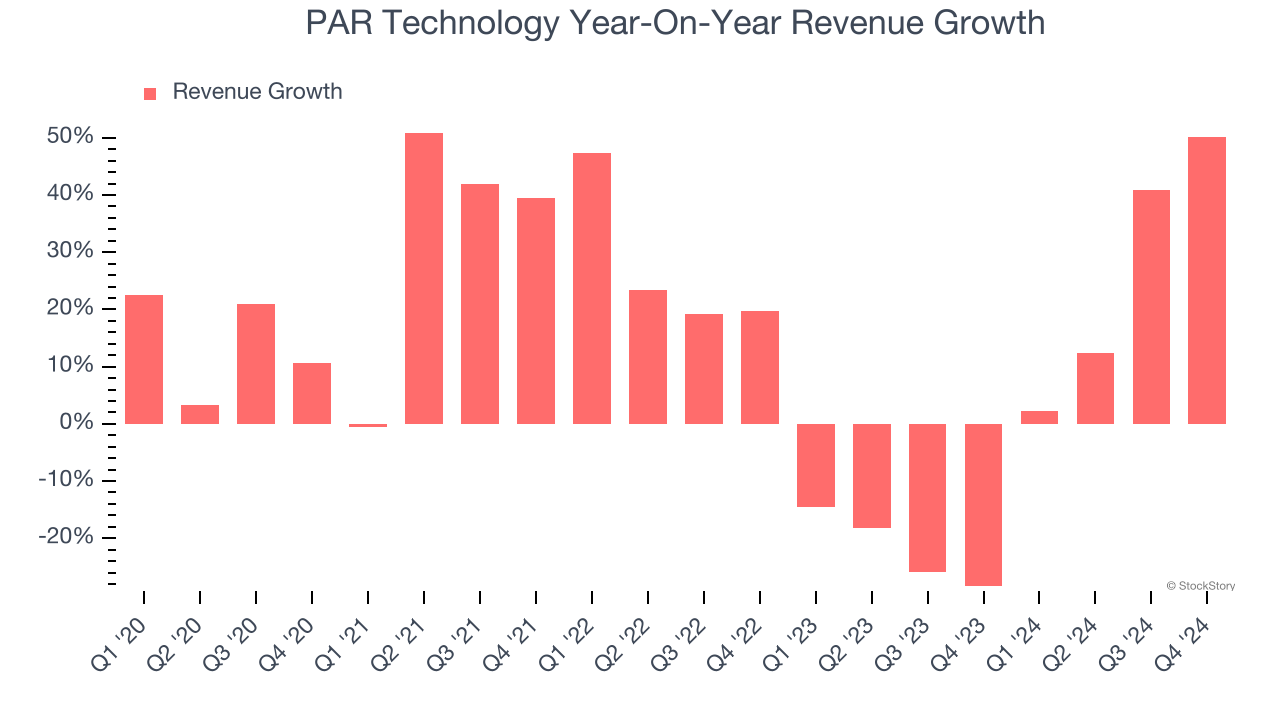
2. Cash Burn Ignites Concerns
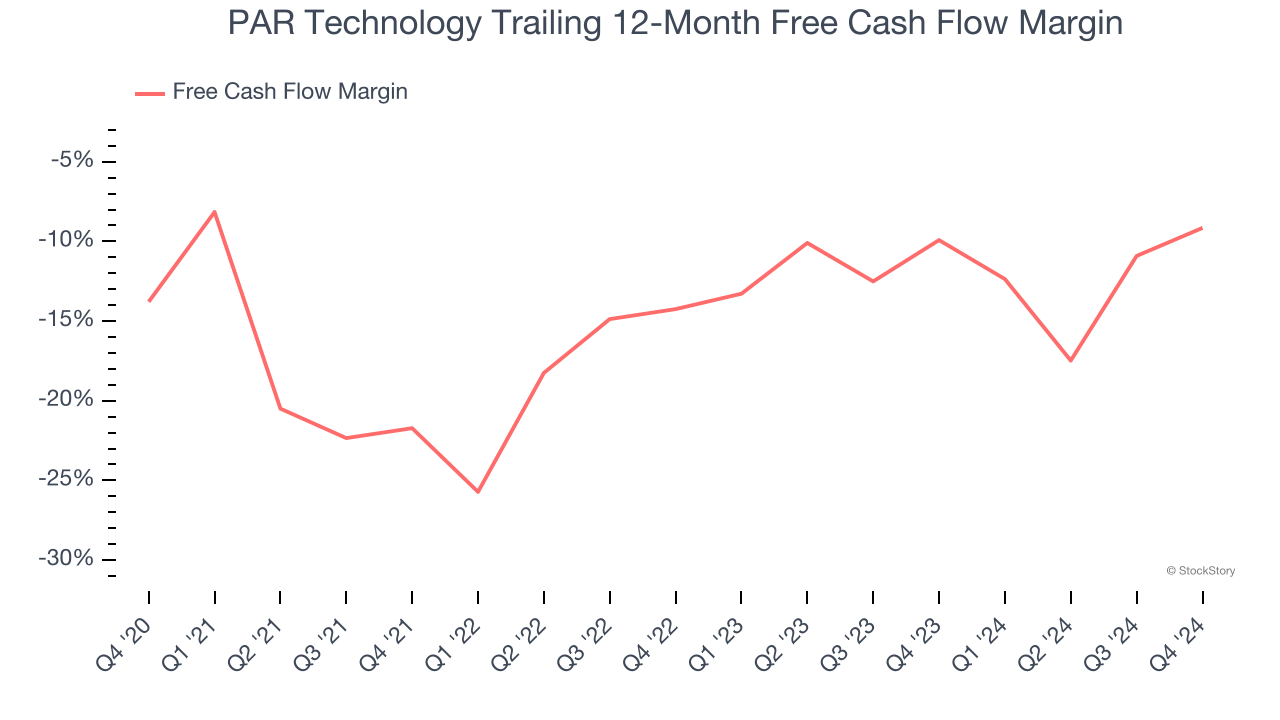
If you’ve followed StockStory for a while, you know we emphasize free cash flow. Why, you ask? We believe that in the end, cash is king, and you can’t use accounting profits to pay the bills.
While PAR Technology posted positive free cash flow this quarter, the broader story hasn’t been so clean. PAR Technology’s demanding reinvestments have drained its resources over the last five years, putting it in a pinch and limiting its ability to return capital to investors. Its free cash flow margin averaged negative 13.6%, meaning it lit $13.59 of cash on fire for every $100 in revenue.
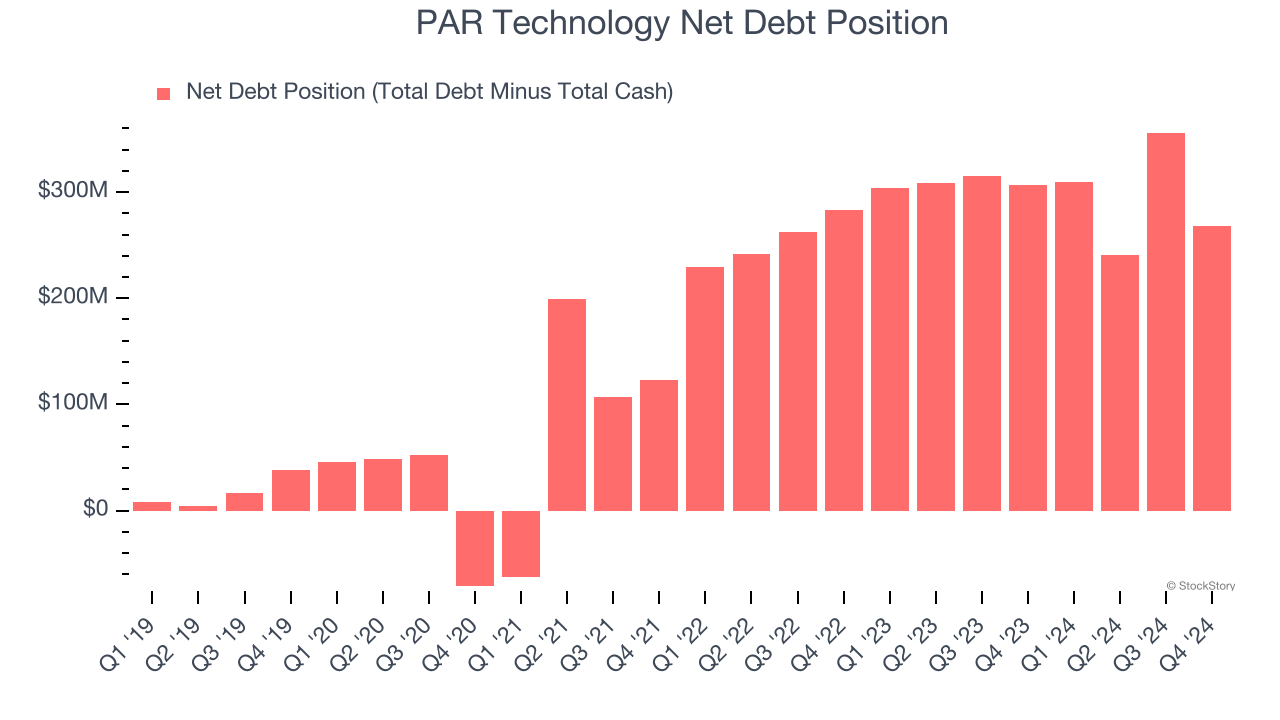
3. Short Cash Runway Exposes Shareholders to Potential Dilution
As long-term investors, the risk we care about most is the permanent loss of capital, which can happen when a company goes bankrupt or raises money from a disadvantaged position. This is separate from short-term stock price volatility, something we are much less bothered by.
PAR Technology burned through $32.03 million of cash over the last year, and its $376.7 million of debt exceeds the $108.6 million of cash on its balance sheet. This is a deal breaker for us because indebted loss-making companies spell trouble.
Unless the PAR Technology’s fundamentals change quickly, it might find itself in a position where it must raise capital from investors to continue operating. Whether that would be favorable is unclear because dilution is a headwind for shareholder returns.
We remain cautious of PAR Technology until it generates consistent free cash flow or any of its announced financing plans materialize on its balance sheet.
Final Judgment
PAR Technology’s business quality ultimately falls short of our standards. That said, the stock currently trades at 61.1× forward EV-to-EBITDA (or $55.35 per share). Beauty is in the eye of the beholder, but we don’t really see a big opportunity at the moment. We're pretty confident there are superior stocks to buy right now. We’d recommend looking at one of our top software and edge computing picks.
Stocks We Would Buy Instead of PAR Technology
Market indices reached historic highs following Donald Trump’s presidential victory in November 2024, but the outlook for 2025 is clouded by new trade policies that could impact business confidence and growth.
While this has caused many investors to adopt a "fearful" wait-and-see approach, we’re leaning into our best ideas that can grow regardless of the political or macroeconomic climate. Take advantage of Mr. Market by checking out our Top 6 Stocks for this week. This is a curated list of our High Quality stocks that have generated a market-beating return of 175% over the last five years.
Stocks that made our list in 2019 include now familiar names such as Nvidia (+2,183% between December 2019 and December 2024) as well as under-the-radar businesses like Comfort Systems (+751% five-year return). Find your next big winner with StockStory today for free.


