As the Q4 earnings season comes to a close, it’s time to take stock of this quarter’s best and worst performers in the sit-down dining industry, including BJ's (NASDAQ: BJRI) and its peers.
Sit-down restaurants offer a complete dining experience with table service. These establishments span various cuisines and are renowned for their warm hospitality and welcoming ambiance, making them perfect for family gatherings, special occasions, or simply unwinding. Their extensive menus range from appetizers to indulgent desserts and wines and cocktails. This space is extremely fragmented and competition includes everything from publicly-traded companies owning multiple chains to single-location mom-and-pop restaurants.
The 13 sit-down dining stocks we track reported a satisfactory Q4. As a group, revenues beat analysts’ consensus estimates by 0.9% while next quarter’s revenue guidance was 2.4% below.
Amidst this news, share prices of the companies have had a rough stretch. On average, they are down 11.9% since the latest earnings results.
BJ's (NASDAQ: BJRI)
Founded in 1978 in California, BJ’s Restaurants (NASDAQ: BJRI) is a chain of restaurants whose menu features classic American dishes, often with a twist.
BJ's reported revenues of $344.3 million, up 6.4% year on year. This print exceeded analysts’ expectations by 2.3%. Overall, it was a stunning quarter for the company with an impressive beat of analysts’ EBITDA estimates and a solid beat of analysts’ same-store sales estimates.
“Our fourth quarter results reflect significant progress in our efforts to drive sales and improve margins,” commented Brad Richmond, Interim Chief Executive Officer.
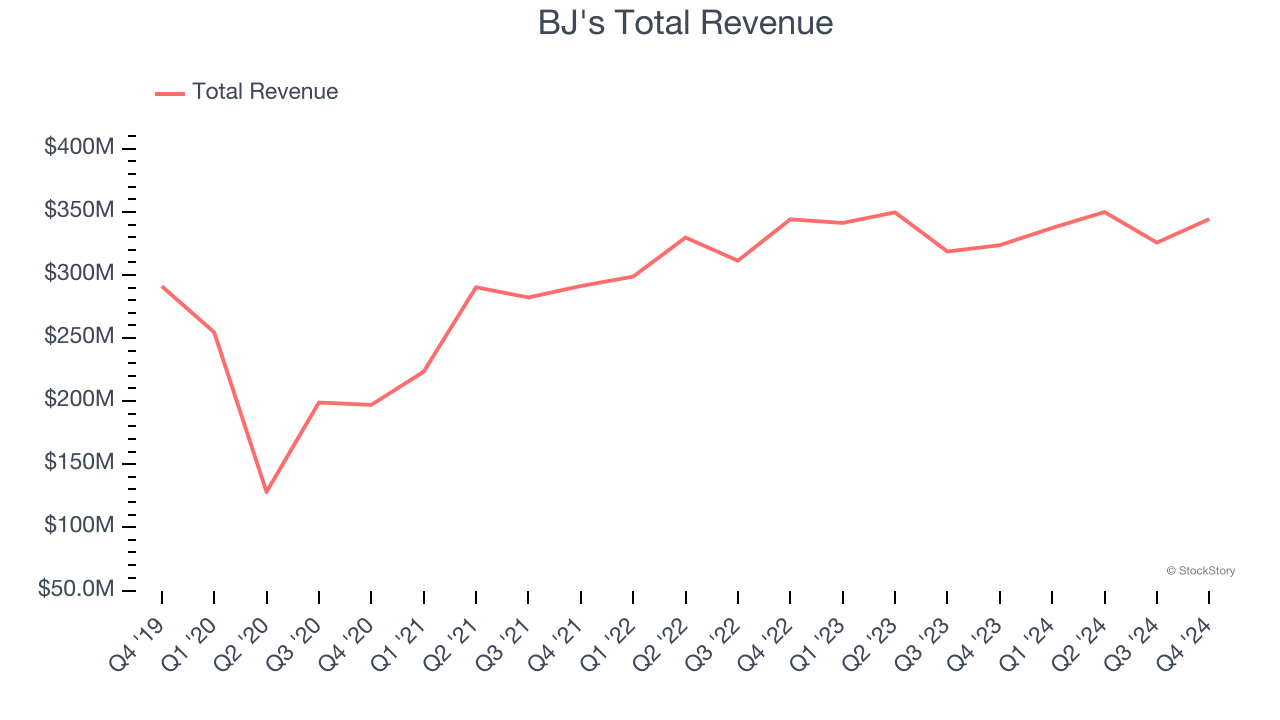
The stock is up 1.6% since reporting and currently trades at $36.28.
Is now the time to buy BJ's? Access our full analysis of the earnings results here, it’s free.
Best Q4: Brinker International (NYSE: EAT)
Founded by Norman Brinker in Dallas, Brinker International (NYSE: EAT) is a casual restaurant chain that operates the Chili’s, Maggiano’s Little Italy, and It’s Just Wings banners.
Brinker International reported revenues of $1.36 billion, up 26.5% year on year, outperforming analysts’ expectations by 9.6%. The business had an incredible quarter with an impressive beat of analysts’ EPS estimates and a solid beat of analysts’ EBITDA estimates.
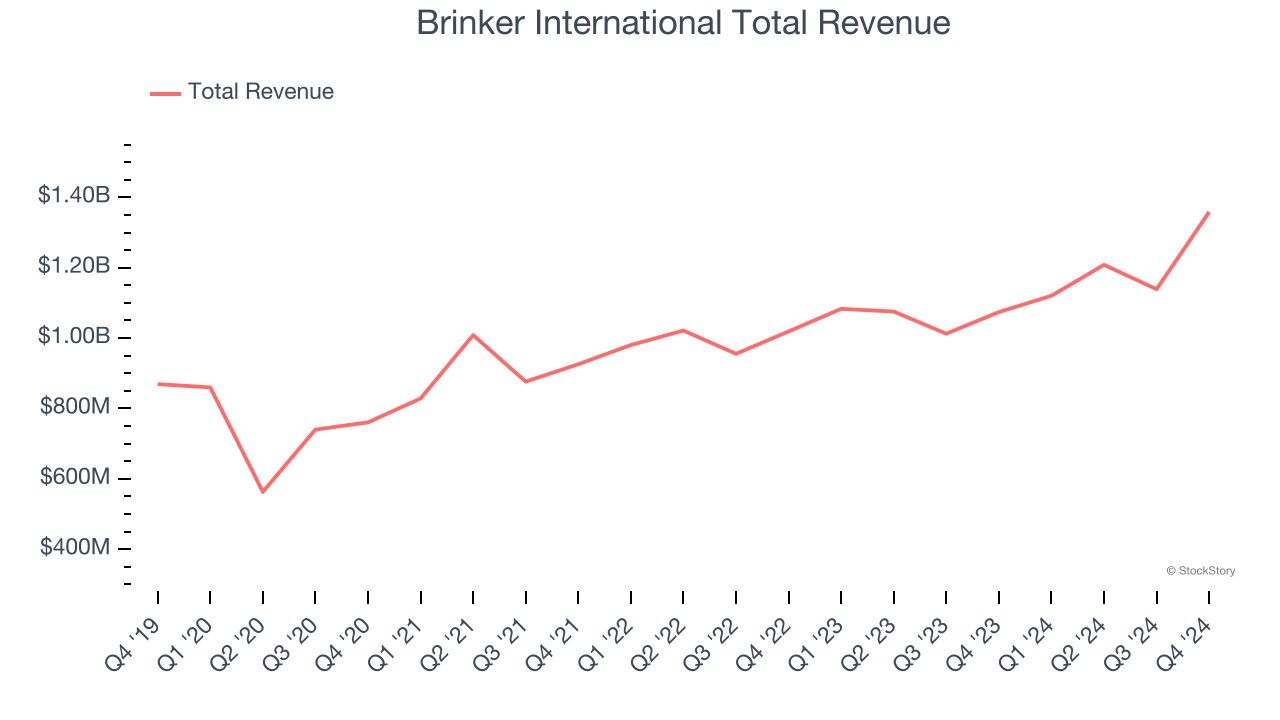
Brinker International delivered the biggest analyst estimates beat and highest full-year guidance raise among its peers. Although it had a fine quarter compared its peers, the market seems unhappy with the results as the stock is down 2.5% since reporting. It currently trades at $150.84.
Is now the time to buy Brinker International? Access our full analysis of the earnings results here, it’s free.
Weakest Q4: Bloomin' Brands (NASDAQ: BLMN)
Owner of the iconic Australian-themed Outback Steakhouse, Bloomin’ Brands (NASDAQ: BLMN) is a leading American restaurant company that owns and operates a portfolio of popular restaurant brands.
Bloomin' Brands reported revenues of $972 million, down 18.6% year on year, falling short of analysts’ expectations by 9.9%. It was a disappointing quarter as it posted full-year EPS guidance missing analysts’ expectations.
Bloomin' Brands delivered the weakest performance against analyst estimates and slowest revenue growth in the group. As expected, the stock is down 35.3% since the results and currently trades at $7.70.
Read our full analysis of Bloomin' Brands’s results here.
The Cheesecake Factory (NASDAQ: CAKE)
Celebrated for its delicious (and free) brown bread, gigantic portions, and delectable desserts, Cheesecake Factory (NASDAQ: CAKE) is an iconic American restaurant chain that also owns and operates a portfolio of separate restaurant brands.
The Cheesecake Factory reported revenues of $921 million, up 5% year on year. This print beat analysts’ expectations by 0.9%. Overall, it was a strong quarter as it also recorded an impressive beat of analysts’ EBITDA estimates and a decent beat of analysts’ EPS estimates.
The stock is down 7.2% since reporting and currently trades at $50.36.
Read our full, actionable report on The Cheesecake Factory here, it’s free.
Texas Roadhouse (NASDAQ: TXRH)
With locations often featuring Western-inspired decor, Texas Roadhouse (NASDAQ: TXRH) is an American restaurant chain specializing in Southern-style cuisine and steaks.
Texas Roadhouse reported revenues of $1.44 billion, up 23.5% year on year. This result topped analysts’ expectations by 2%. It was a very strong quarter as it also logged a solid beat of analysts’ EBITDA estimates and a decent beat of analysts’ EPS estimates.
The stock is down 2.3% since reporting and currently trades at $167.72.
Read our full, actionable report on Texas Roadhouse here, it’s free.
Want to invest in winners with rock-solid fundamentals? Check out our Top 5 Growth Stocks and add them to your watchlist. These companies are poised for growth regardless of the political or macroeconomic climate.
Join Paid Stock Investor Research
Help us make StockStory more helpful to investors like yourself. Join our paid user research session and receive a $50 Amazon gift card for your opinions. Sign up here.


