Mayville Engineering has gotten torched over the last six months - since October 2024, its stock price has dropped 34.2% to $13 per share. This was partly driven by its softer quarterly results and may have investors wondering how to approach the situation.
Is there a buying opportunity in Mayville Engineering, or does it present a risk to your portfolio? Check out our in-depth research report to see what our analysts have to say, it’s free.
Despite the more favorable entry price, we're swiping left on Mayville Engineering for now. Here are three reasons why you should be careful with MEC and a stock we'd rather own.
Why Do We Think Mayville Engineering Will Underperform?
Originally founded solely on tool and die manufacturing, Mayville Engineering Company (NYSE: MEC) specializes in metal fabrication, tube bending, and welding to be used in various industries.
1. Long-Term Revenue Growth Disappoints
A company’s long-term performance is an indicator of its overall quality. Any business can put up a good quarter or two, but many enduring ones grow for years. Unfortunately, Mayville Engineering’s 2.3% annualized revenue growth over the last five years was sluggish. This fell short of our benchmarks. 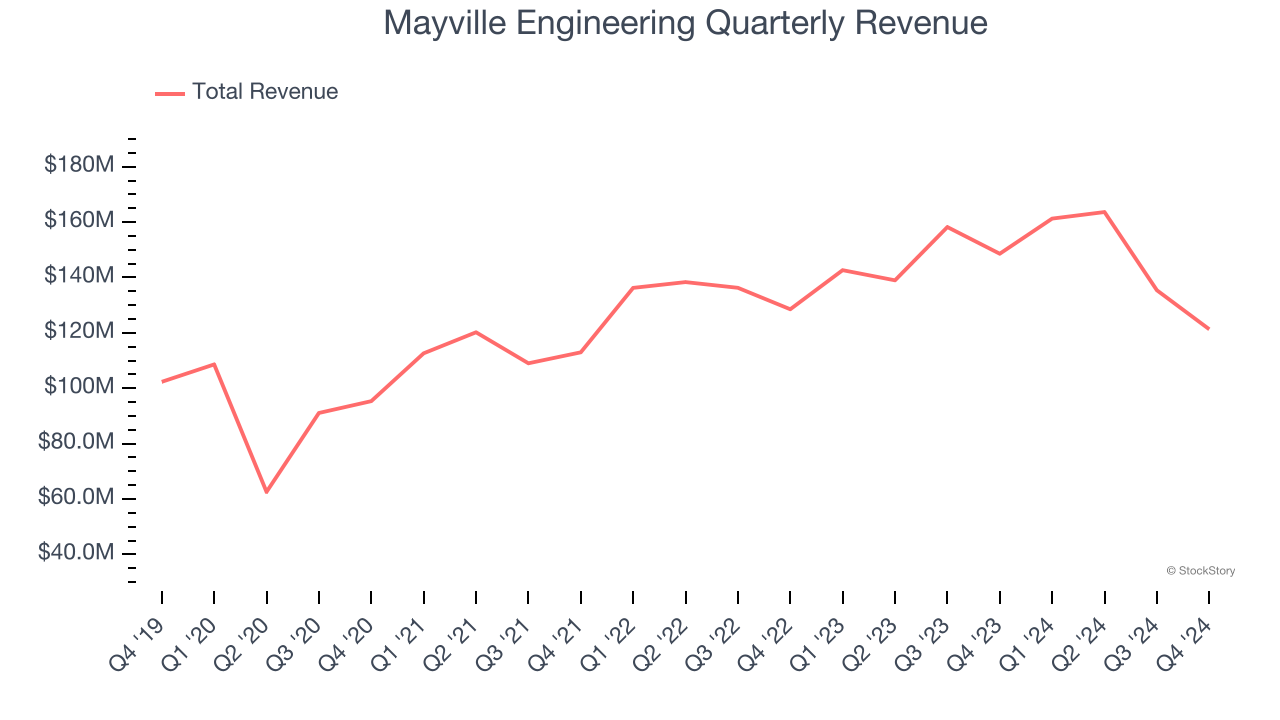
2. Low Gross Margin Reveals Weak Structural Profitability
For industrials businesses, cost of sales is usually comprised of the direct labor, raw materials, and supplies needed to offer a product or service. These costs can be impacted by inflation and supply chain dynamics in the short term and a company’s purchasing power and scale over the long term.
Mayville Engineering has bad unit economics for an industrials business, signaling it operates in a competitive market. As you can see below, it averaged a 12.5% gross margin over the last five years. That means Mayville Engineering paid its suppliers a lot of money ($87.51 for every $100 in revenue) to run its business. 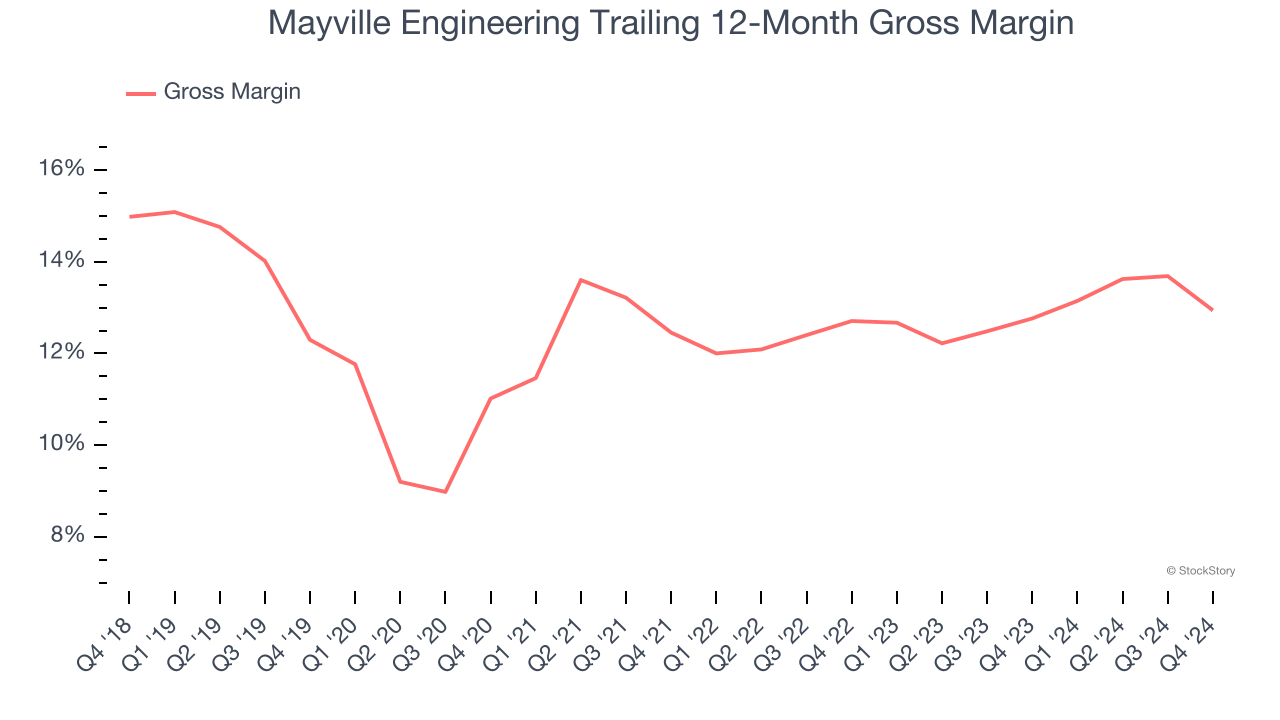
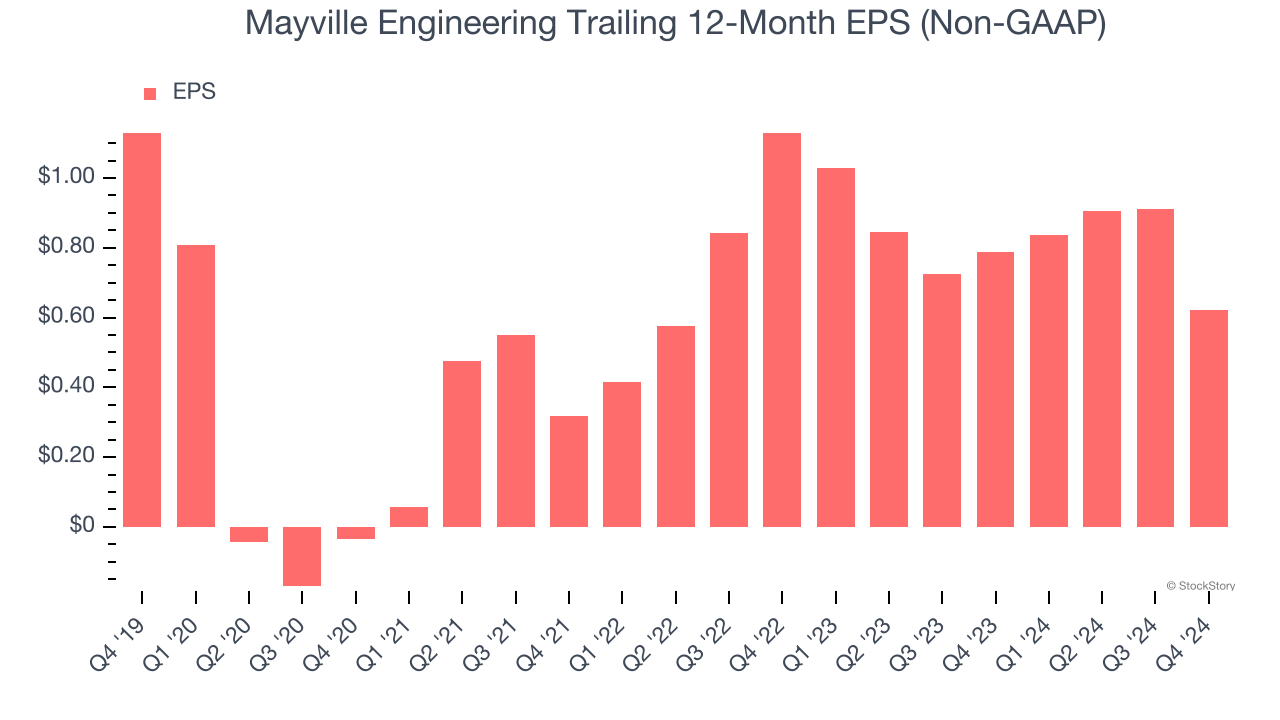
3. EPS Trending Down
We track the long-term change in earnings per share (EPS) because it highlights whether a company’s growth is profitable.
Sadly for Mayville Engineering, its EPS declined by 11.2% annually over the last five years while its revenue grew by 2.3%. This tells us the company became less profitable on a per-share basis as it expanded.
Final Judgment
Mayville Engineering doesn’t pass our quality test. Following the recent decline, the stock trades at 4.2× forward EV-to-EBITDA (or $13 per share). This valuation is reasonable, but the company’s shaky fundamentals present too much downside risk. There are better investments elsewhere. We’d suggest looking at one of our top digital advertising picks.
Stocks We Would Buy Instead of Mayville Engineering
Donald Trump’s victory in the 2024 U.S. Presidential Election sent major indices to all-time highs, but stocks have retraced as investors debate the health of the economy and the potential impact of tariffs.
While this leaves much uncertainty around 2025, a few companies are poised for long-term gains regardless of the political or macroeconomic climate, like our Top 6 Stocks for this week. This is a curated list of our High Quality stocks that have generated a market-beating return of 175% over the last five years.
Stocks that made our list in 2019 include now familiar names such as Nvidia (+2,183% between December 2019 and December 2024) as well as under-the-radar businesses like Comfort Systems (+751% five-year return). Find your next big winner with StockStory today for free.