Premium cinema technology company IMAX (NYSE: IMAX) reported Q1 CY2025 results topping the market’s revenue expectations, with sales up 9.5% year on year to $86.67 million. Its GAAP profit of $0.04 per share was $0.01 below analysts’ consensus estimates.
Is now the time to buy IMAX? Find out by accessing our full research report, it’s free.
IMAX (IMAX) Q1 CY2025 Highlights:
- Revenue: $86.67 million vs analyst estimates of $84.23 million (9.5% year-on-year growth, 2.9% beat)
- EPS (GAAP): $0.04 vs analyst estimates of $0.05 ($0.01 miss)
- Adjusted EBITDA: $36.98 million vs analyst estimates of $27.9 million (42.7% margin, 32.5% beat)
- Operating Margin: 19.3%, up from 15.3% in the same quarter last year
- Free Cash Flow was $5.31 million, up from -$18.11 million in the same quarter last year
- Market Capitalization: $1.25 billion
“IMAX is off to an excellent start in 2025 — the fundamentals of our business have never been stronger, with record global box office and strong system sales and installations growth in the First Quarter,” said Rich Gelfond, CEO of IMAX.
Company Overview
Originally developed for World Expo '67 in Montreal as an innovative projection system, IMAX (NYSE: IMAX) provides proprietary large-format cinema technology and systems that deliver immersive movie experiences with enhanced image quality and sound.
Traditional Media & Publishing
The sector faces structural headwinds from declining linear TV viewership, shifts in advertising spend toward digital platforms, and ongoing challenges in monetizing print and broadcast content. However, for companies that invest wisely, tailwinds can include AI, the power of which can result in more personalized content creation and more detailed audience analysis. These can create a flywheel of success where one feeds into the other. Still there are outstanding questions around AI-generated content oversight, and the regulatory framework around this could evolve in unseen ways over the next few years.
Sales Growth
A company’s long-term performance is an indicator of its overall quality. Any business can experience short-term success, but top-performing ones enjoy sustained growth for years.
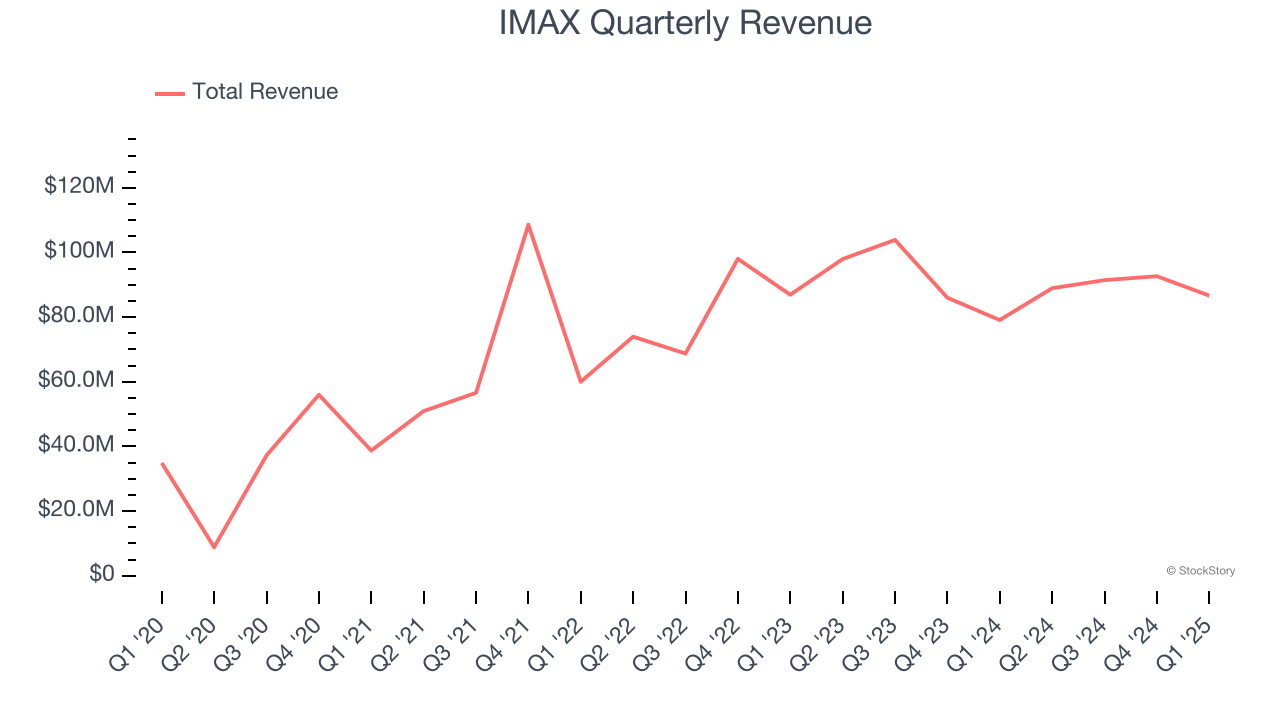
With $359.8 million in revenue over the past 12 months, IMAX is a small player in the business services space, which sometimes brings disadvantages compared to larger competitors benefiting from economies of scale and numerous distribution channels.
As you can see below, IMAX struggled to increase demand as its $359.8 million of sales for the trailing 12 months was close to its revenue five years ago. This shows demand was soft, a poor baseline for our analysis.
We at StockStory place the most emphasis on long-term growth, but within business services, a half-decade historical view may miss recent innovations or disruptive industry trends. IMAX’s annualized revenue growth of 4.8% over the last two years is above its five-year trend, but we were still disappointed by the results. 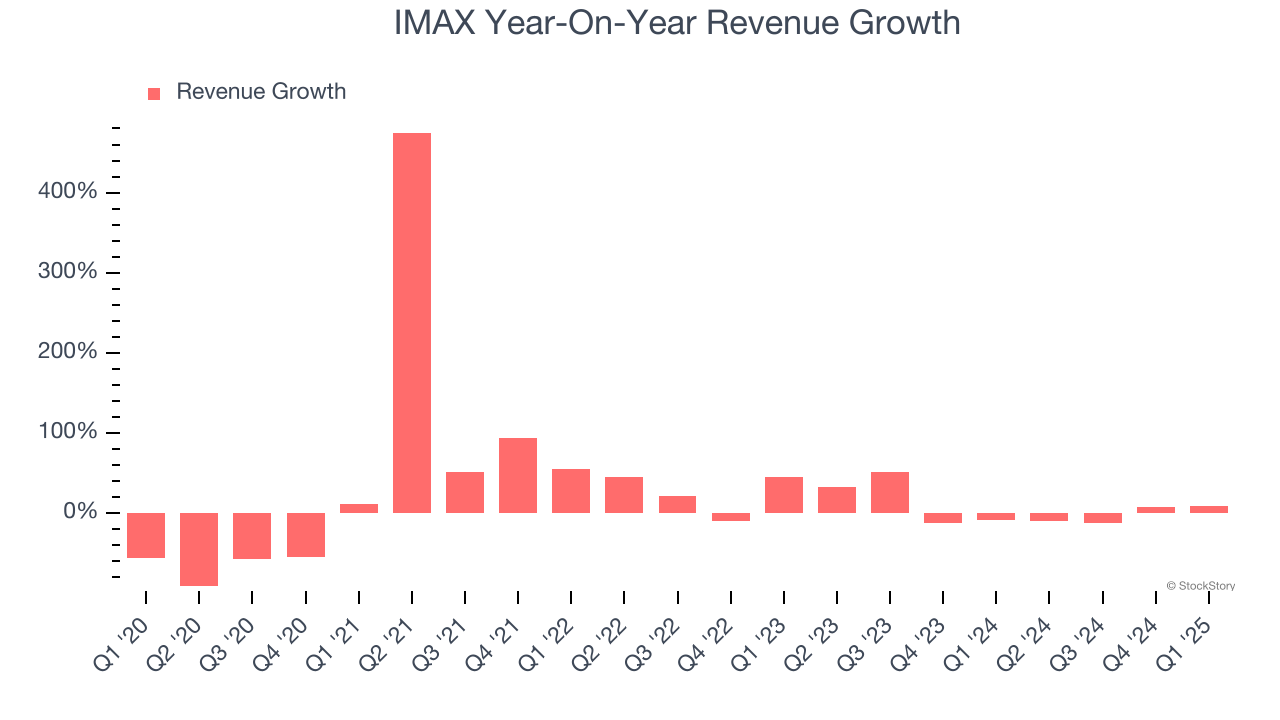
This quarter, IMAX reported year-on-year revenue growth of 9.5%, and its $86.67 million of revenue exceeded Wall Street’s estimates by 2.9%.
Looking ahead, sell-side analysts expect revenue to grow 13.8% over the next 12 months, an improvement versus the last two years. This projection is commendable and implies its newer products and services will fuel better top-line performance.
Unless you’ve been living under a rock, it should be obvious by now that generative AI is going to have a huge impact on how large corporations do business. While Nvidia and AMD are trading close to all-time highs, we prefer a lesser-known (but still profitable) stock benefiting from the rise of AI. Click here to access our free report one of our favorites growth stories.
Operating Margin
Operating margin is an important measure of profitability as it shows the portion of revenue left after accounting for all core expenses – everything from the cost of goods sold to advertising and wages. It’s also useful for comparing profitability across companies with different levels of debt and tax rates because it excludes interest and taxes.
IMAX was profitable over the last five years but held back by its large cost base. Its average operating margin of 2.3% was weak for a business services business.
On the plus side, IMAX’s operating margin rose by 80.4 percentage points over the last five years.
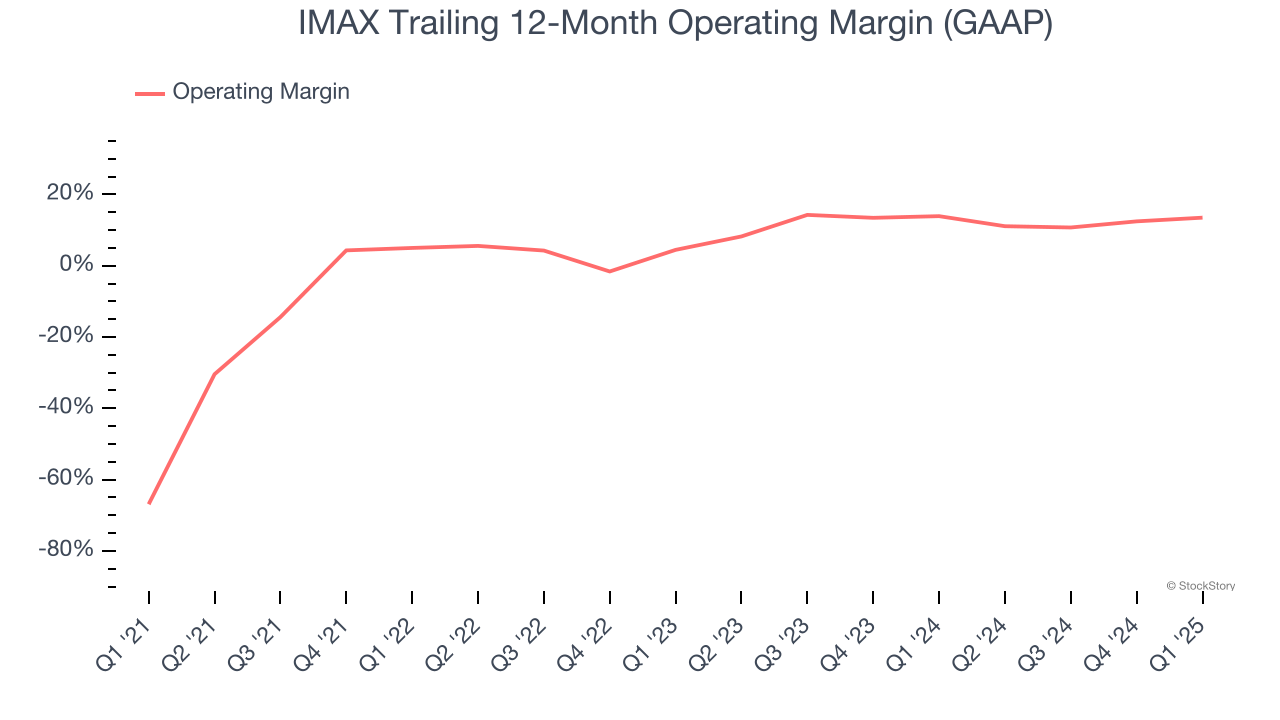
In Q1, IMAX generated an operating profit margin of 19.3%, up 4.1 percentage points year on year. This increase was a welcome development and shows it was more efficient.
Earnings Per Share
We track the long-term change in earnings per share (EPS) for the same reason as long-term revenue growth. Compared to revenue, however, EPS highlights whether a company’s growth is profitable.
IMAX’s full-year EPS flipped from negative to positive over the last five years. This is encouraging and shows it’s at a critical moment in its life.
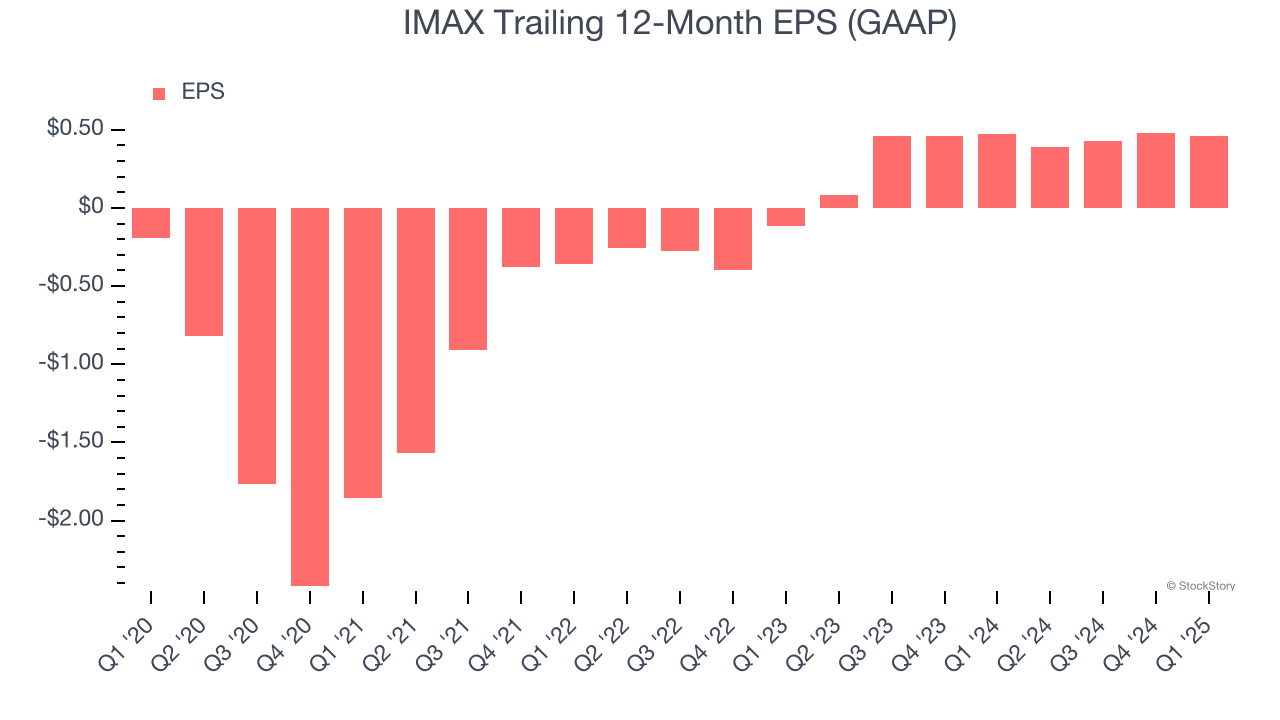
In Q1, IMAX reported EPS at $0.04, down from $0.06 in the same quarter last year. This print missed analysts’ estimates, but we care more about long-term EPS growth than short-term movements. Over the next 12 months, Wall Street expects IMAX’s full-year EPS of $0.46 to grow 90.2%.
Key Takeaways from IMAX’s Q1 Results
We enjoyed seeing IMAX beat analysts’ revenue and EBITDA expectations this quarter. Overall, this was a decent quarter. The stock traded up 4% to $25.02 immediately after reporting.
Is IMAX an attractive investment opportunity at the current price? When making that decision, it’s important to consider its valuation, business qualities, as well as what has happened in the latest quarter. We cover that in our actionable full research report which you can read here, it’s free.


