
Pest control company Rollins (NYSE: ROL) met Wall Street’s revenue expectations in Q1 CY2025, with sales up 9.9% year on year to $822.5 million. Its non-GAAP profit of $0.22 per share was in line with analysts’ consensus estimates.
Is now the time to buy Rollins? Find out by accessing our full research report, it’s free.
Rollins (ROL) Q1 CY2025 Highlights:
- Revenue: $822.5 million vs analyst estimates of $820 million (9.9% year-on-year growth, in line)
- Adjusted EPS: $0.22 vs analyst estimates of $0.22 (in line)
- Adjusted EBITDA: $171.9 million vs analyst estimates of $173.6 million (20.9% margin, 1% miss)
- Operating Margin: 17.3%, in line with the same quarter last year
- Free Cash Flow Margin: 17%, similar to the same quarter last year
- Organic Revenue was up 7.4% year on year
- Market Capitalization: $27 billion
Company Overview
Operating under multiple brands like Orkin and HomeTeam Pest Defense, Rollins (NYSE: ROL) provides pest and wildlife control services to residential and commercial customers.
Facility Services
Many facility services are non-discretionary (office building bathrooms need to be cleaned), recurring, and performed through contracts. This makes for more predictable and stickier revenue streams. However, COVID changed the game regarding commercial real estate, and office vacancies remain high as hybrid work seems here to stay. This is a headwind for demand, and facility services companies are also at the whim of economic cycles. Interest rates, for example, can greatly impact commercial construction projects that drive incremental demand for these companies’ services.
Sales Growth
A company’s long-term sales performance can indicate its overall quality. Any business can have short-term success, but a top-tier one grows for years. Thankfully, Rollins’s 10.8% annualized revenue growth over the last five years was impressive. Its growth surpassed the average industrials company and shows its offerings resonate with customers, a great starting point for our analysis.
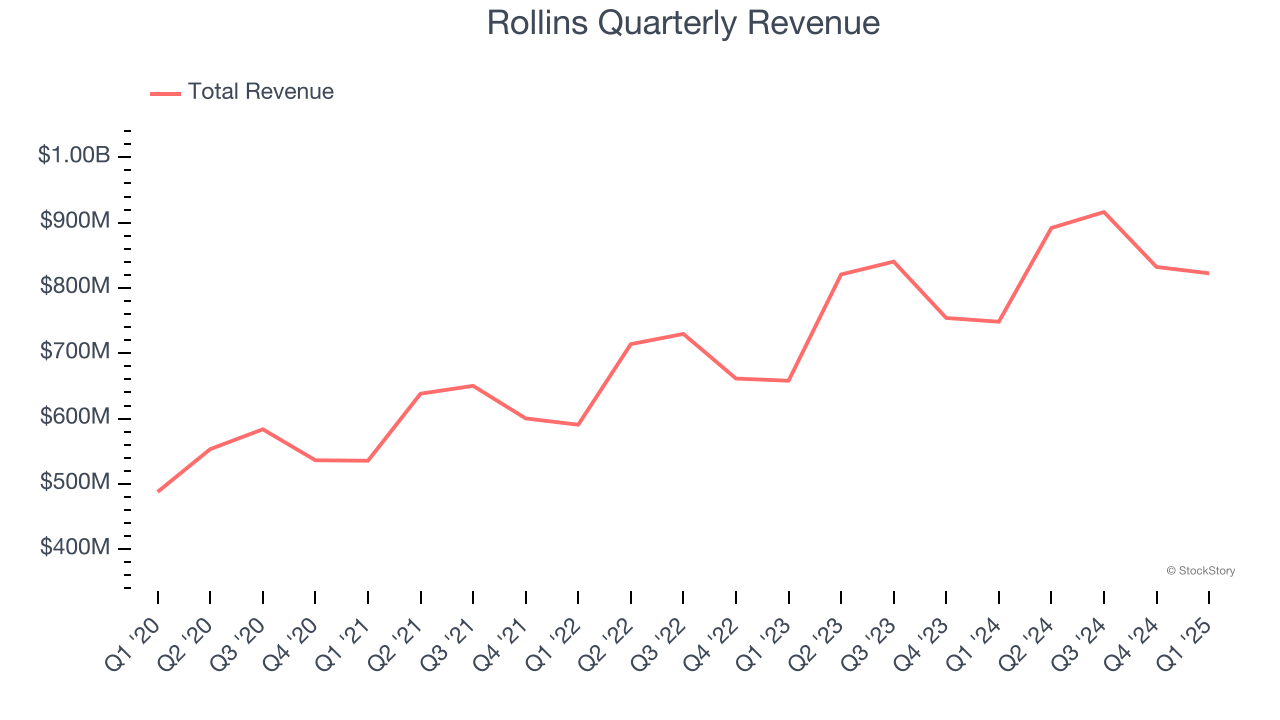
Long-term growth is the most important, but within industrials, a half-decade historical view may miss new industry trends or demand cycles. Rollins’s annualized revenue growth of 11.9% over the last two years is above its five-year trend, suggesting its demand was strong and recently accelerated.
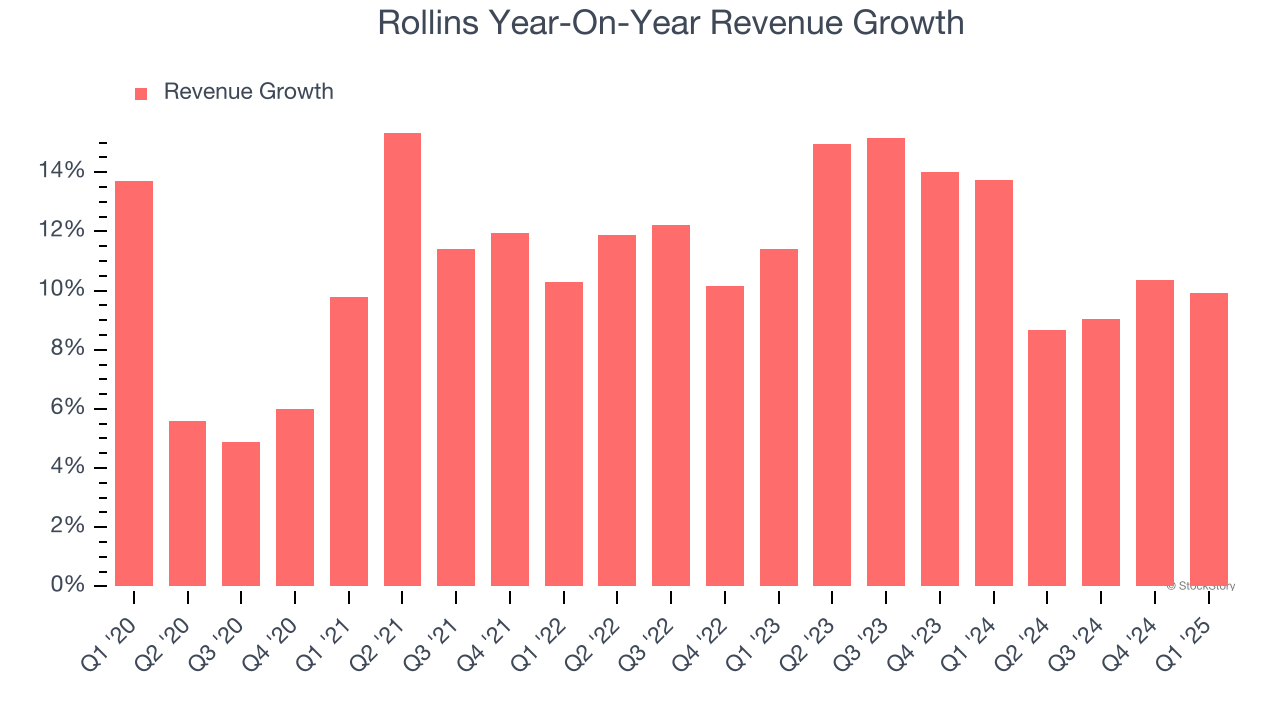
This quarter, Rollins grew its revenue by 9.9% year on year, and its $822.5 million of revenue was in line with Wall Street’s estimates.
Looking ahead, sell-side analysts expect revenue to grow 9.6% over the next 12 months, a slight deceleration versus the last two years. Still, this projection is healthy and suggests the market is forecasting success for its products and services.
Software is eating the world and there is virtually no industry left that has been untouched by it. That drives increasing demand for tools helping software developers do their jobs, whether it be monitoring critical cloud infrastructure, integrating audio and video functionality, or ensuring smooth content streaming. Click here to access a free report on our 3 favorite stocks to play this generational megatrend.
Operating Margin
Rollins has been a well-oiled machine over the last five years. It demonstrated elite profitability for an industrials business, boasting an average operating margin of 18.6%. This result isn’t surprising as its high gross margin gives it a favorable starting point.
Analyzing the trend in its profitability, Rollins’s operating margin rose by 1.2 percentage points over the last five years, as its sales growth gave it operating leverage.
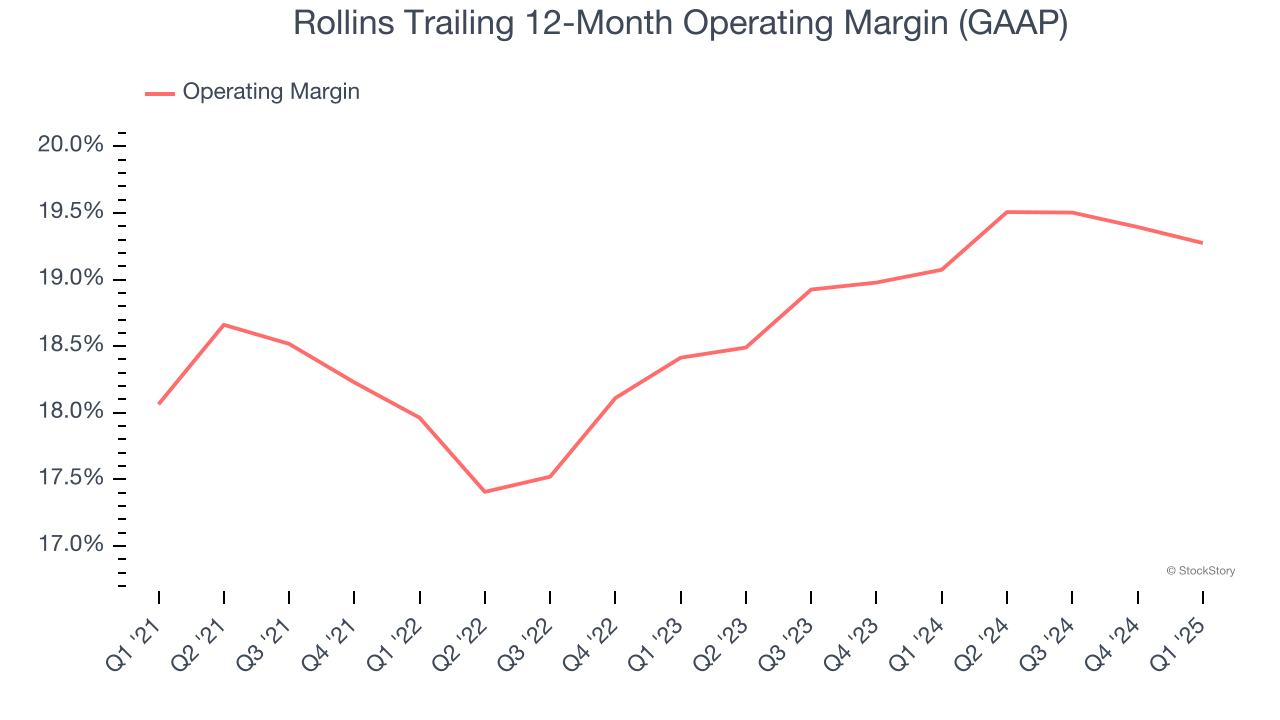
In Q1, Rollins generated an operating profit margin of 17.3%, in line with the same quarter last year. This indicates the company’s cost structure has recently been stable.
Earnings Per Share
Revenue trends explain a company’s historical growth, but the long-term change in earnings per share (EPS) points to the profitability of that growth – for example, a company could inflate its sales through excessive spending on advertising and promotions.
Rollins’s EPS grew at a spectacular 16.3% compounded annual growth rate over the last five years, higher than its 10.8% annualized revenue growth. This tells us the company became more profitable on a per-share basis as it expanded.
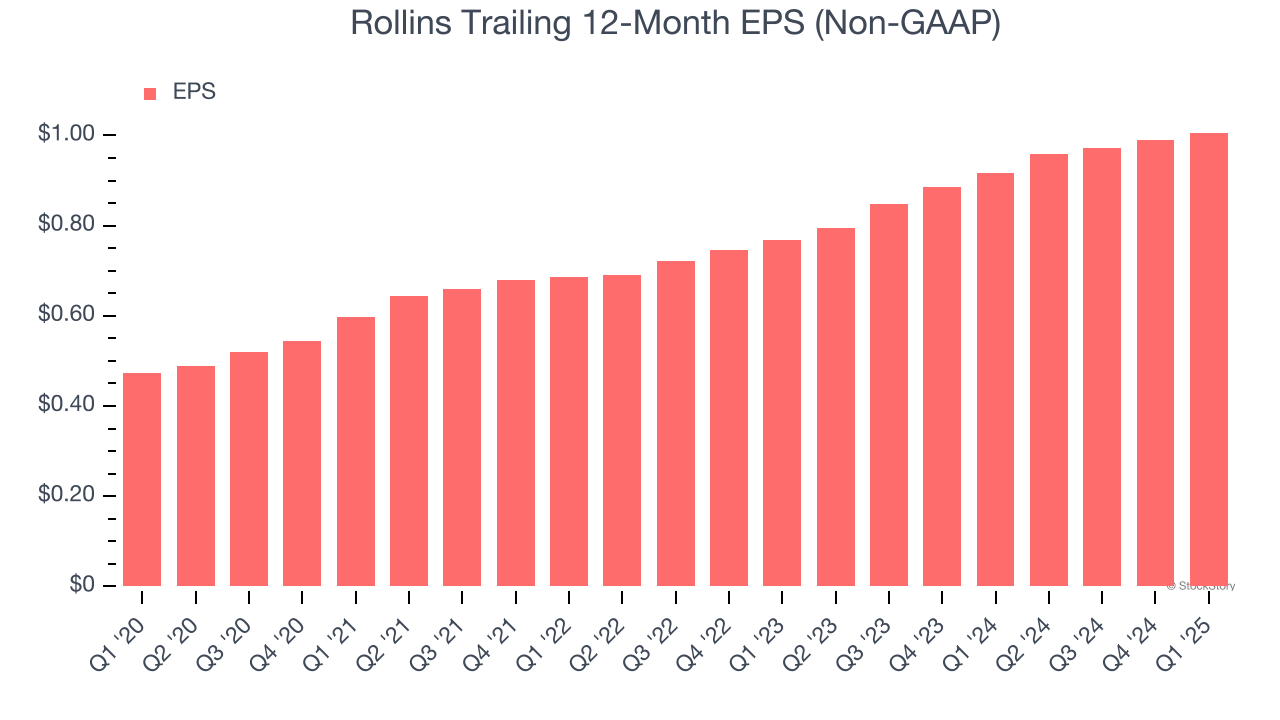
We can take a deeper look into Rollins’s earnings quality to better understand the drivers of its performance. As we mentioned earlier, Rollins’s operating margin was flat this quarter but expanded by 1.2 percentage points over the last five years. On top of that, its share count shrank by 1.4%. These are positive signs for shareholders because improving profitability and share buybacks turbocharge EPS growth relative to revenue growth. 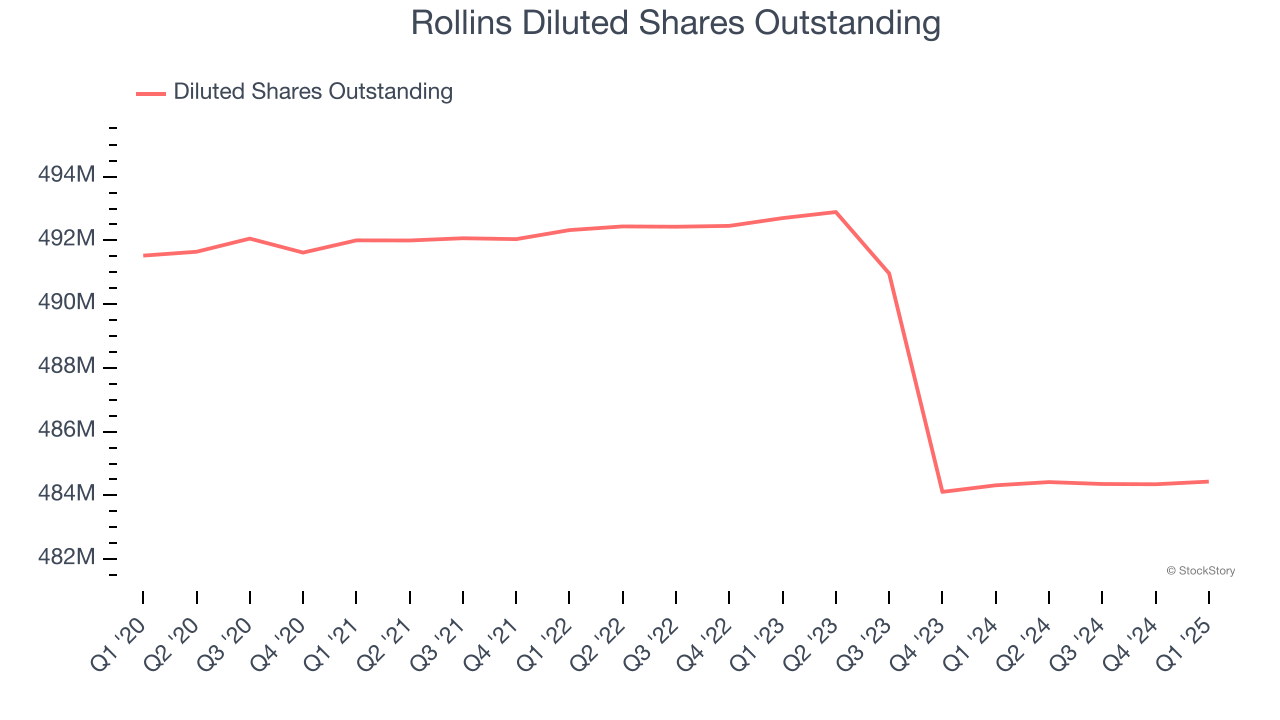
Like with revenue, we analyze EPS over a more recent period because it can provide insight into an emerging theme or development for the business.
For Rollins, its two-year annual EPS growth of 14.5% was lower than its five-year trend. We still think its growth was good and hope it can accelerate in the future.
In Q1, Rollins reported EPS at $0.22, up from $0.20 in the same quarter last year. This print beat analysts’ estimates by 1.3%. Over the next 12 months, Wall Street expects Rollins’s full-year EPS of $1.01 to grow 14.2%.
Key Takeaways from Rollins’s Q1 Results
This was a fairly in-line quarter, with revenue and EPS meeting expectations. The stock remained flat at $54.93 immediately after reporting.
So should you invest in Rollins right now? We think that the latest quarter is only one piece of the longer-term business quality puzzle. Quality, when combined with valuation, can help determine if the stock is a buy. We cover that in our actionable full research report which you can read here, it’s free.


