
Amentum has gotten torched over the last six months - since October 2024, its stock price has dropped 34.1% to $19.75 per share. This might have investors contemplating their next move.
Is there a buying opportunity in Amentum, or does it present a risk to your portfolio? Dive into our full research report to see our analyst team’s opinion, it’s free.
Even though the stock has become cheaper, we're cautious about Amentum. Here are three reasons why you should be careful with AMTM and a stock we'd rather own.
Why Do We Think Amentum Will Underperform?
With operations spanning approximately 80 countries and a workforce of specialized engineers and technical experts, Amentum Holdings (NYSE: AMTM) provides advanced engineering and technology solutions to U.S. government agencies, allied governments, and commercial enterprises across defense, energy, and space sectors.
1. Long-Term Revenue Growth Disappoints
A company’s long-term sales performance can indicate its overall quality. Any business can put up a good quarter or two, but many enduring ones grow for years. Regrettably, Amentum’s sales grew at a tepid 4% compounded annual growth rate over the last two years. This was below our standard for the business services sector. 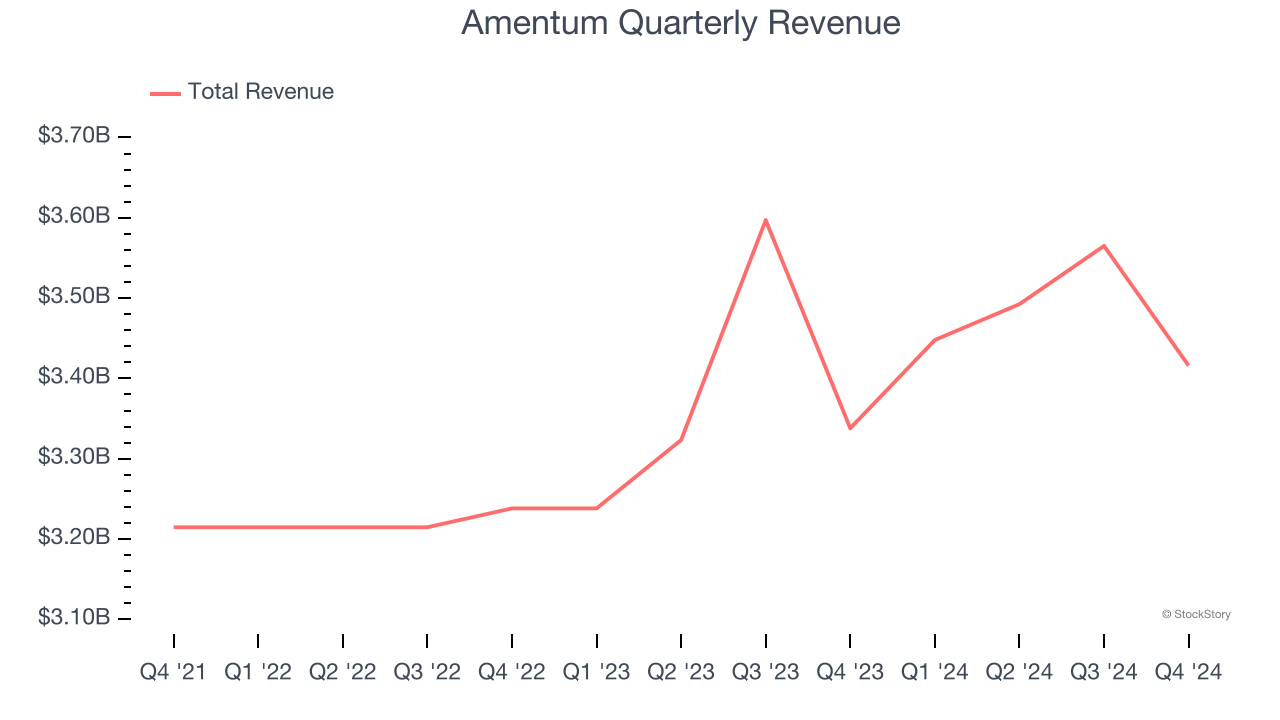
2. Projected Revenue Growth Is Slim
Forecasted revenues by Wall Street analysts signal a company’s potential. Predictions may not always be accurate, but accelerating growth typically boosts valuation multiples and stock prices while slowing growth does the opposite.
Over the next 12 months, sell-side analysts expect Amentum’s revenue to rise by 1.6%, a slight deceleration versus its 4% annualized growth for the past two years. This projection is underwhelming and indicates its products and services will see some demand headwinds.
3. Mediocre Free Cash Flow Margin Limits Reinvestment Potential
If you’ve followed StockStory for a while, you know we emphasize free cash flow. Why, you ask? We believe that in the end, cash is king, and you can’t use accounting profits to pay the bills.
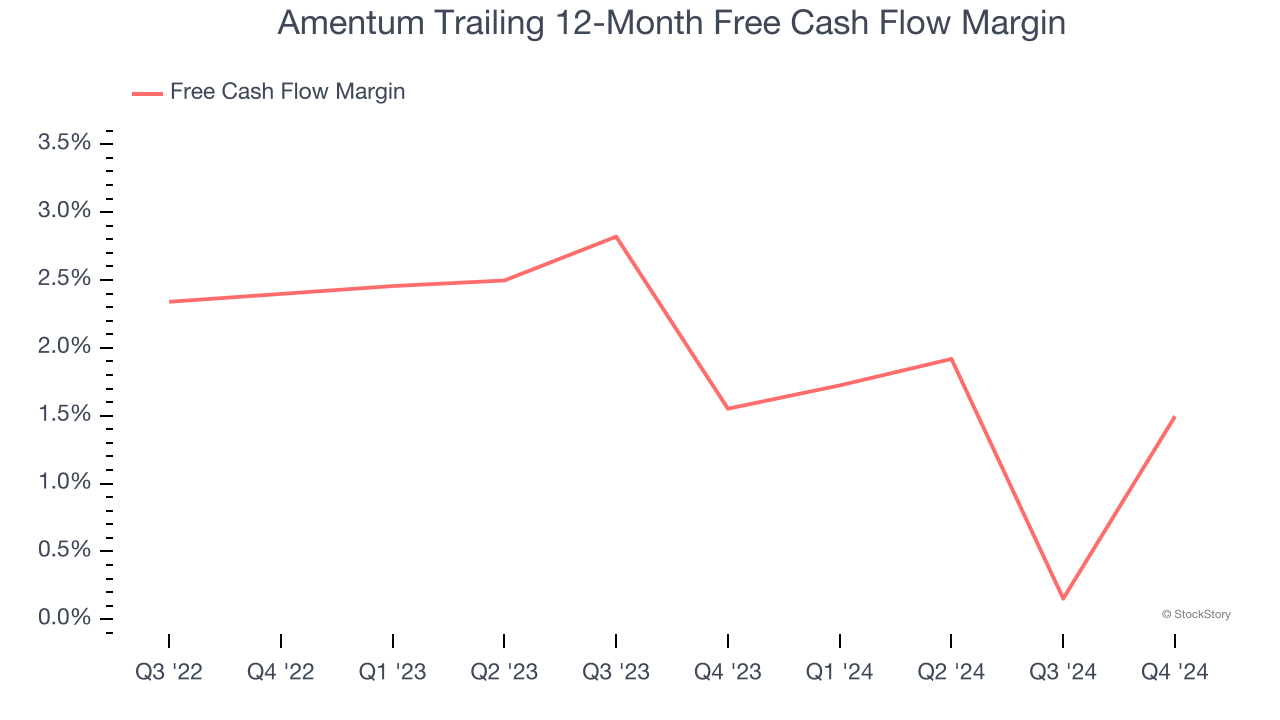
Amentum has shown poor cash profitability over the last three years, giving the company limited opportunities to return capital to shareholders. Its free cash flow margin averaged 1.8%, lousy for a business services business.
Final Judgment
Amentum falls short of our quality standards. Following the recent decline, the stock trades at 9.2× forward price-to-earnings (or $19.75 per share). While this valuation is optically cheap, the potential downside is huge given its shaky fundamentals. There are better investments elsewhere. Let us point you toward a safe-and-steady industrials business benefiting from an upgrade cycle.
Stocks We Like More Than Amentum
Market indices reached historic highs following Donald Trump’s presidential victory in November 2024, but the outlook for 2025 is clouded by new trade policies that could impact business confidence and growth.
While this has caused many investors to adopt a "fearful" wait-and-see approach, we’re leaning into our best ideas that can grow regardless of the political or macroeconomic climate. Take advantage of Mr. Market by checking out our Top 5 Growth Stocks for this month. This is a curated list of our High Quality stocks that have generated a market-beating return of 175% over the last five years.
Stocks that made our list in 2019 include now familiar names such as Nvidia (+2,183% between December 2019 and December 2024) as well as under-the-radar businesses like Sterling Infrastructure (+1,096% five-year return). Find your next big winner with StockStory today for free.