Rural goods retailer Tractor Supply (NASDAQ: TSCO) missed Wall Street’s revenue expectations in Q1 CY2025 as sales rose 2.1% year on year to $3.47 billion. The company’s full-year revenue guidance of $6 billion at the midpoint came in 61.8% below analysts’ estimates. Its GAAP profit of $0.34 per share was 7.9% below analysts’ consensus estimates.
Is now the time to buy Tractor Supply? Find out by accessing our full research report, it’s free.
Tractor Supply (TSCO) Q1 CY2025 Highlights:
- Revenue: $3.47 billion vs analyst estimates of $3.53 billion (2.1% year-on-year growth, 1.9% miss)
- EPS (GAAP): $0.34 vs analyst expectations of $0.37 (7.9% miss)
- Adjusted EBITDA: $382.4 million vs analyst estimates of $386.1 million (11% margin, 1% miss)
- EPS (GAAP) guidance for the full year is $2.00 at the midpoint, missing analyst estimates by 7.5%
- Operating Margin: 7.2%, in line with the same quarter last year
- Free Cash Flow Margin: 2.2%, similar to the same quarter last year
- Locations: 2,311 at quarter end, down from 2,435 in the same quarter last year
- Same-Store Sales were flat year on year (1.1% in the same quarter last year)
- Market Capitalization: $26.97 billion
Company Overview
Started as a mail-order tractor parts business, Tractor Supply (NASDAQ: TSCO) is a retailer of general goods such as agricultural supplies, hardware, and pet food for the rural consumer.
Specialty Retail
Some retailers try to sell everything under the sun, while others—appropriately called Specialty Retailers—focus on selling a narrow category and aiming to be exceptional at it. Whether it’s eyeglasses, sporting goods, or beauty and cosmetics, these stores win with depth of product in their category as well as in-store expertise and guidance for shoppers who need it. E-commerce competition exists and waning retail foot traffic impacts these retailers, but the magnitude of the headwinds depends on what they sell and what extra value they provide in their stores.
Sales Growth
A company’s long-term performance is an indicator of its overall quality. Any business can have short-term success, but a top-tier one grows for years.
With $14.96 billion in revenue over the past 12 months, Tractor Supply is one of the larger companies in the consumer retail industry and benefits from a well-known brand that influences purchasing decisions.
As you can see below, Tractor Supply’s sales grew at a decent 10.9% compounded annual growth rate over the last six years (we compare to 2019 to normalize for COVID-19 impacts) as it opened new stores and expanded its reach.
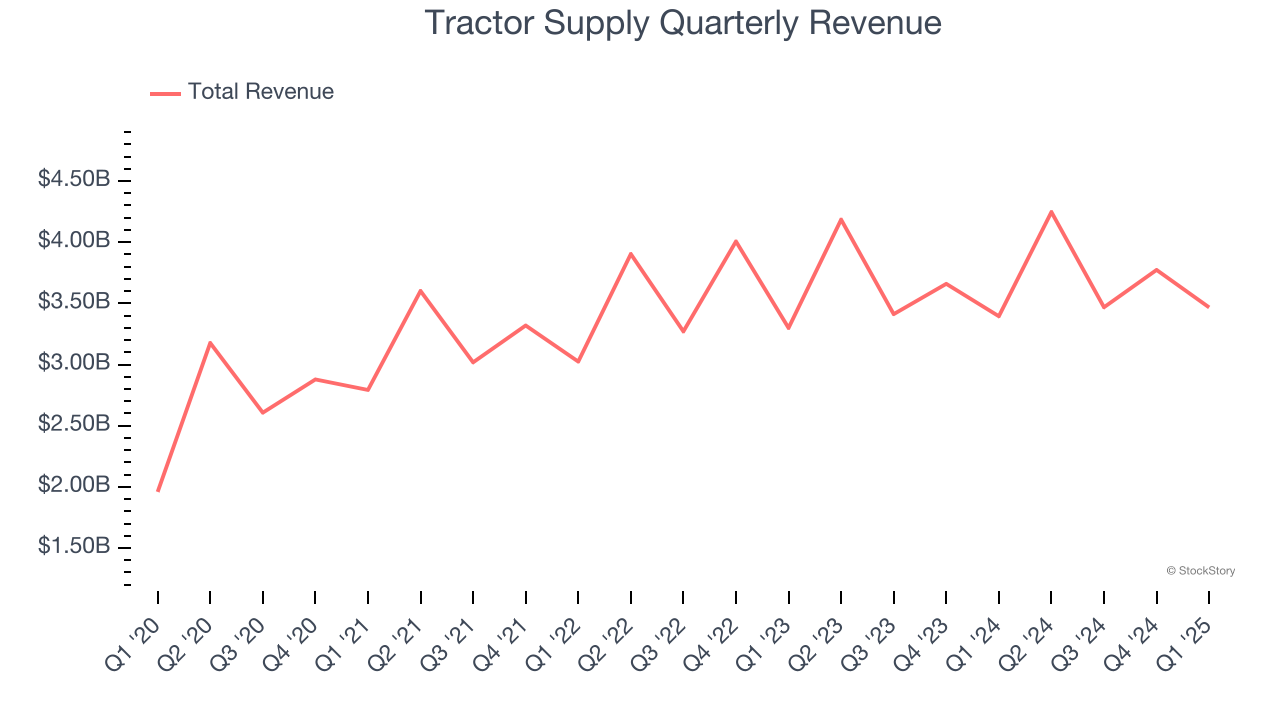
This quarter, Tractor Supply’s revenue grew by 2.1% year on year to $3.47 billion, falling short of Wall Street’s estimates.
Looking ahead, sell-side analysts expect revenue to grow 6.5% over the next 12 months, a deceleration versus the last six years. We still think its growth trajectory is attractive given its scale and suggests the market sees success for its products.
Software is eating the world and there is virtually no industry left that has been untouched by it. That drives increasing demand for tools helping software developers do their jobs, whether it be monitoring critical cloud infrastructure, integrating audio and video functionality, or ensuring smooth content streaming. Click here to access a free report on our 3 favorite stocks to play this generational megatrend.
Store Performance
Number of Stores
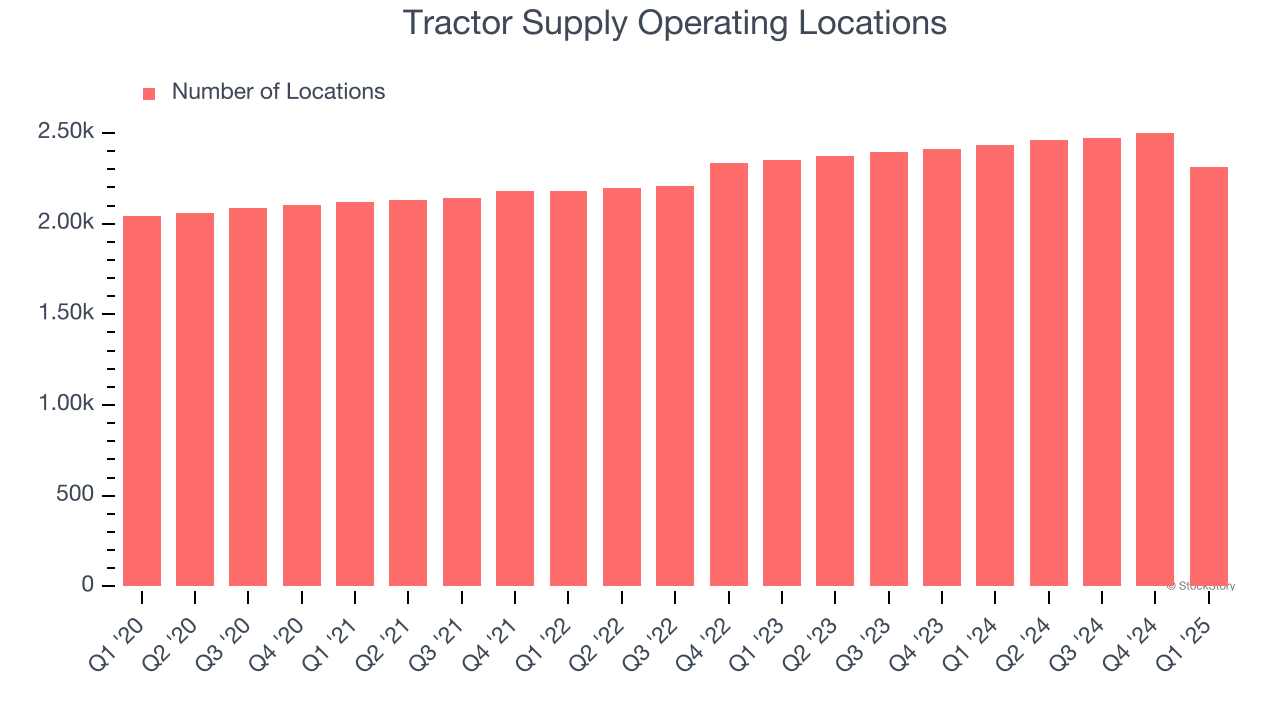
Tractor Supply sported 2,311 locations in the latest quarter. Over the last two years, it has opened new stores at a rapid clip by averaging 3.6% annual growth, among the fastest in the consumer retail sector.
When a retailer opens new stores, it usually means it’s investing for growth because demand is greater than supply, especially in areas where consumers may not have a store within reasonable driving distance.
Same-Store Sales
The change in a company's store base only tells one side of the story. The other is the performance of its existing locations and e-commerce sales, which informs management teams whether they should expand or downsize their physical footprints. Same-store sales is an industry measure of whether revenue is growing at those existing stores and is driven by customer visits (often called traffic) and the average spending per customer (ticket).
Tractor Supply’s demand within its existing locations has barely increased over the last two years as its same-store sales were flat. Tractor Supply should consider improving its foot traffic and efficiency before expanding its store base.
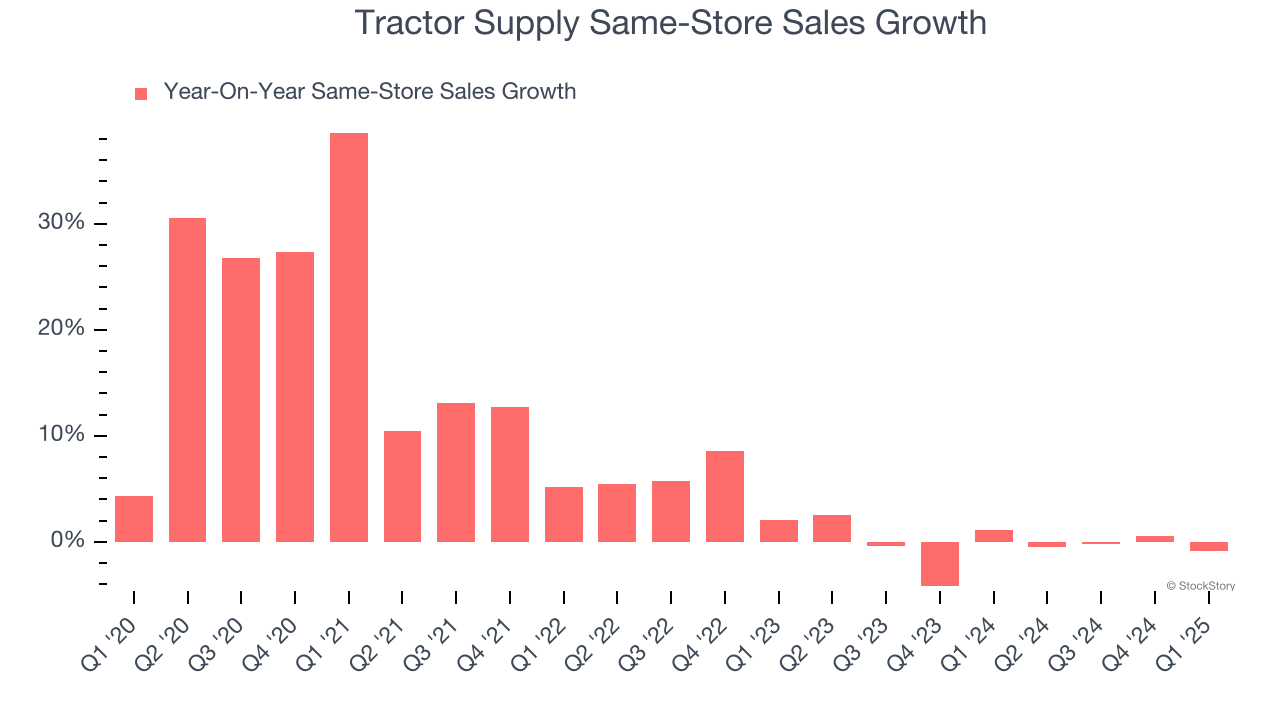
In the latest quarter, Tractor Supply’s year on year same-store sales were flat. This performance was more or less in line with its historical levels.
Key Takeaways from Tractor Supply’s Q1 Results
We struggled to find many positives in these results. Its full-year revenue guidance missed significantly and its full-year EPS guidance fell short of Wall Street’s estimates. Overall, this was a weaker quarter. The stock traded down 4.4% to $48.44 immediately following the results.
Tractor Supply’s latest earnings report disappointed. One quarter doesn’t define a company’s quality, so let’s explore whether the stock is a buy at the current price. What happened in the latest quarter matters, but not as much as longer-term business quality and valuation, when deciding whether to invest in this stock. We cover that in our actionable full research report which you can read here, it’s free.


