
Kellanova currently trades at $82.54 per share and has shown little upside over the past six months, posting a middling return of 2.1%. However, the stock is beating the S&P 500’s 5.3% decline during that period.
Is there a buying opportunity in Kellanova, or does it present a risk to your portfolio? Get the full breakdown from our expert analysts, it’s free.
Even with the strong relative performance, we're sitting this one out for now. Here are three reasons why there are better opportunities than K and a stock we'd rather own.
Why Is Kellanova Not Exciting?
With Corn Flakes as its first and most iconic product, Kellanova (NYSE: K) is a packaged foods company that is dominant in the cereal and snack categories.
1. Demand Slipping as Sales Volumes Decline
Revenue growth can be broken down into changes in price and volume (the number of units sold). While both are important, volume is the lifeblood of a successful staples business as there’s a ceiling to what consumers will pay for everyday goods; they can always trade down to non-branded products if the branded versions are too expensive.
Kellanova’s average quarterly sales volumes have shrunk by 2.8% over the last two years. This decrease isn’t ideal because the quantity demanded for consumer staples products is typically stable. 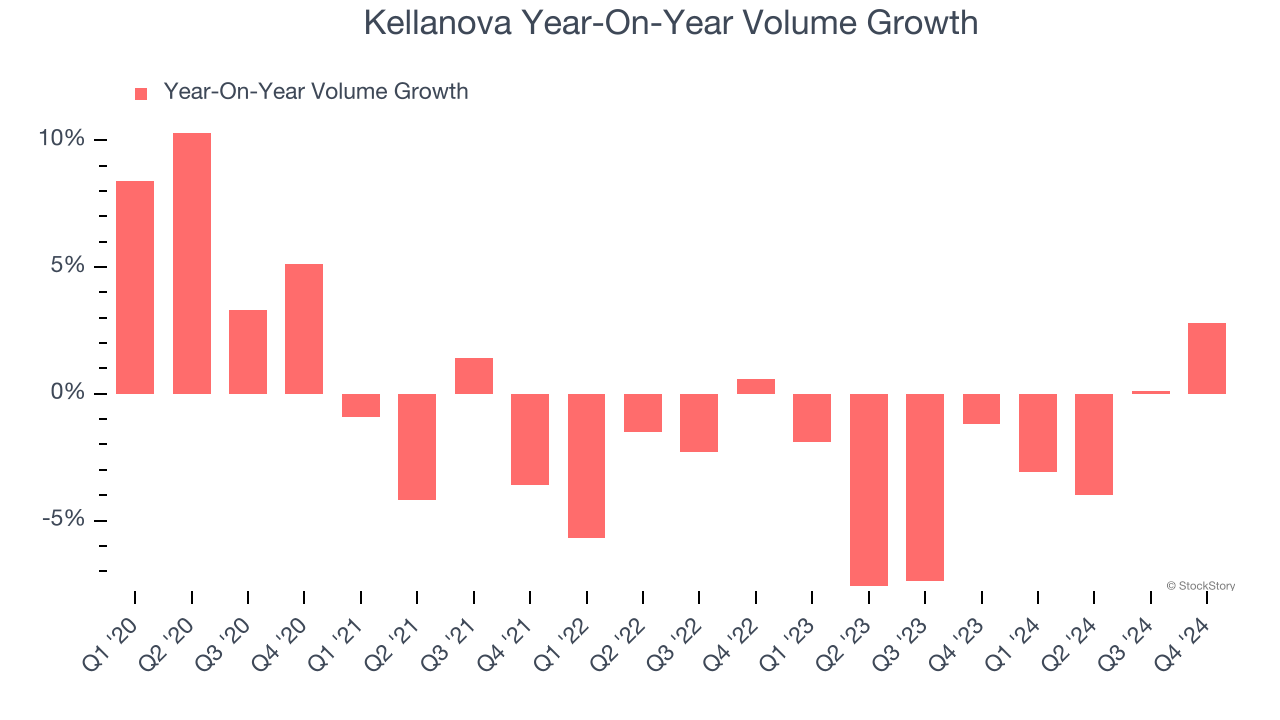
2. Projected Revenue Growth Shows Limited Upside
Forecasted revenues by Wall Street analysts signal a company’s potential. Predictions may not always be accurate, but accelerating growth typically boosts valuation multiples and stock prices while slowing growth does the opposite.
Over the next 12 months, sell-side analysts expect Kellanova’s revenue to stall. While this projection implies its newer products will spur better top-line performance, it is still below the sector average.
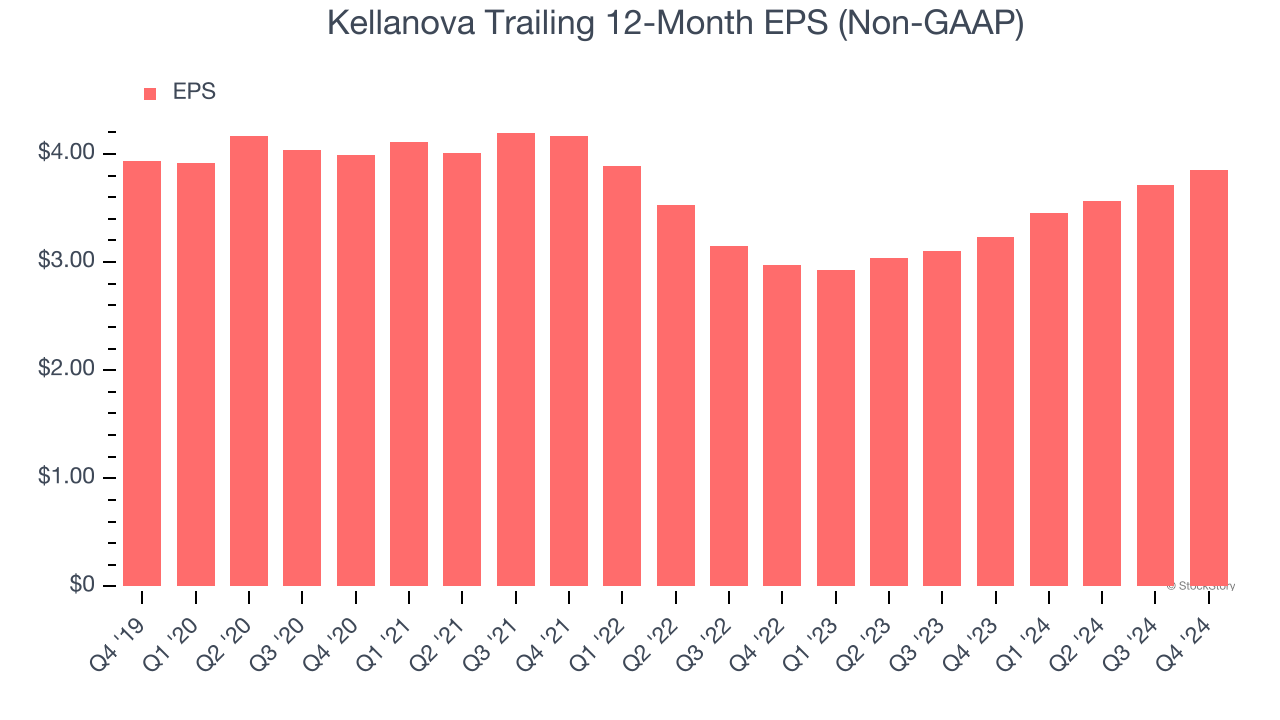
3. EPS Trending Down
We track the change in earnings per share (EPS) because it highlights whether a company’s growth is profitable.
Sadly for Kellanova, its EPS and revenue declined by 2.5% and 3.5% annually over the last three years. We tend to steer our readers away from companies with falling revenue and EPS, where diminishing earnings could imply changing secular trends and preferences. If the tide turns unexpectedly, Kellanova’s low margin of safety could leave its stock price susceptible to large downswings.
Final Judgment
Kellanova isn’t a terrible business, but it doesn’t pass our bar. Following its recent outperformance amid a softer market environment, the stock trades at 21.1× forward price-to-earnings (or $82.54 per share). This multiple tells us a lot of good news is priced in - we think there are better stocks to buy right now. We’d recommend looking at the Amazon and PayPal of Latin America.
Stocks We Would Buy Instead of Kellanova
Donald Trump’s victory in the 2024 U.S. Presidential Election sent major indices to all-time highs, but stocks have retraced as investors debate the health of the economy and the potential impact of tariffs.
While this leaves much uncertainty around 2025, a few companies are poised for long-term gains regardless of the political or macroeconomic climate, like our Top 5 Growth Stocks for this month. This is a curated list of our High Quality stocks that have generated a market-beating return of 175% over the last five years.
Stocks that made our list in 2019 include now familiar names such as Nvidia (+2,183% between December 2019 and December 2024) as well as under-the-radar businesses like Comfort Systems (+751% five-year return). Find your next big winner with StockStory today for free.


