Hospital management company Universal Health Services (NYSE: UHS) missed Wall Street’s revenue expectations in Q1 CY2025, but sales rose 6.7% year on year to $4.1 billion. Its GAAP profit of $4.80 per share was 8.9% above analysts’ consensus estimates.
Is now the time to buy Universal Health Services? Find out by accessing our full research report, it’s free.
Universal Health Services (UHS) Q1 CY2025 Highlights:
- Revenue: $4.1 billion vs analyst estimates of $4.15 billion (6.7% year-on-year growth, 1.2% miss)
- EPS (GAAP): $4.80 vs analyst estimates of $4.41 (8.9% beat)
- Adjusted EBITDA: $598.2 million vs analyst estimates of $569 million (14.6% margin, 5.1% beat)
- Operating Margin: 11.1%, in line with the same quarter last year
- Free Cash Flow Margin: 3%, down from 4.9% in the same quarter last year
- Same-Store Sales rose 2.4% year on year (4.5% in the same quarter last year)
- Market Capitalization: $11.19 billion
Company Overview
With a network spanning 39 states and three countries, Universal Health Services (NYSE: UHS) operates acute care hospitals and behavioral health facilities across the United States, United Kingdom, and Puerto Rico.
Sales Growth
Examining a company’s long-term performance can provide clues about its quality. Any business can experience short-term success, but top-performing ones enjoy sustained growth for years. Regrettably, Universal Health Services’s sales grew at a mediocre 7.1% compounded annual growth rate over the last five years. This fell short of our benchmark for the healthcare sector and is a poor baseline for our analysis.
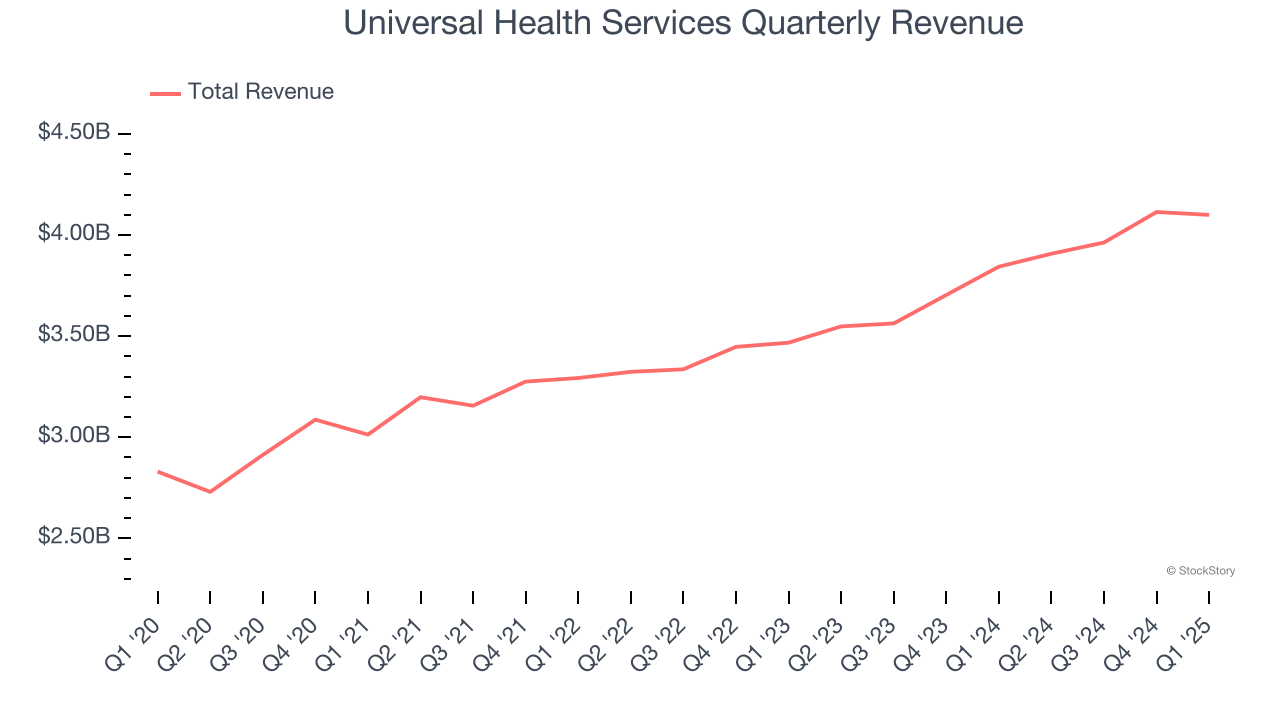
Long-term growth is the most important, but within healthcare, a half-decade historical view may miss new innovations or demand cycles. Universal Health Services’s annualized revenue growth of 8.9% over the last two years is above its five-year trend, suggesting some bright spots. 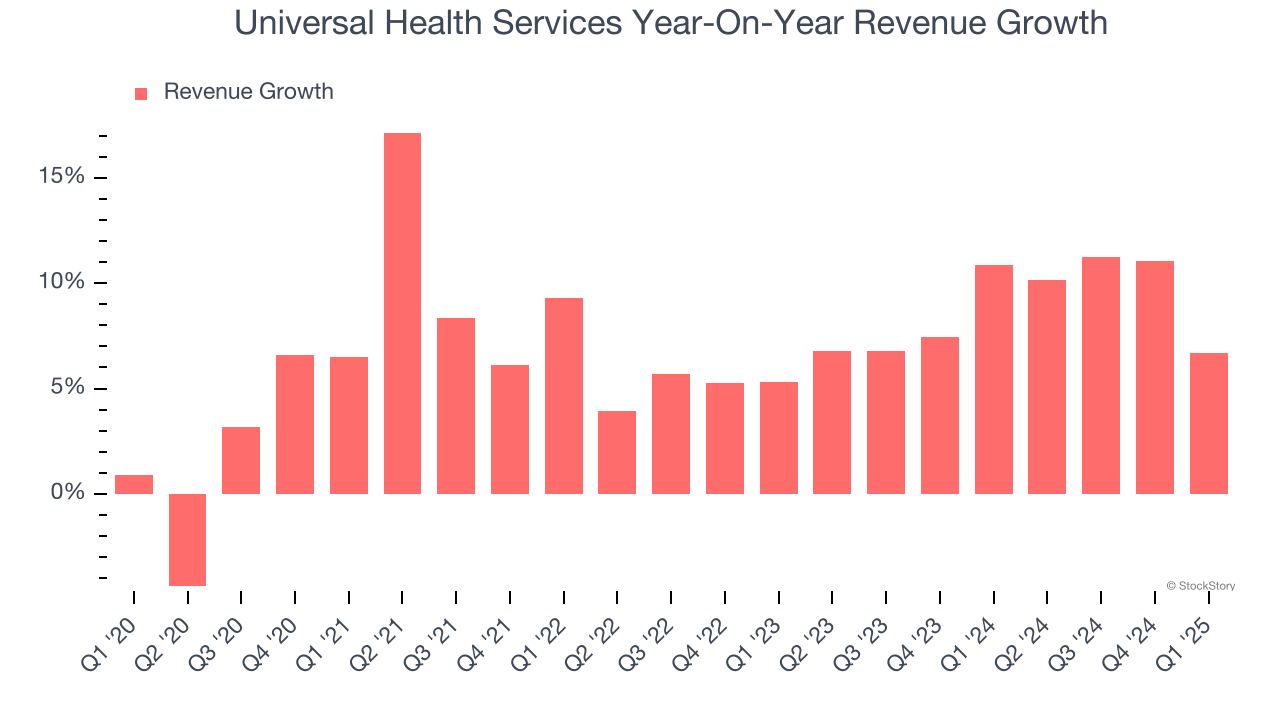
We can better understand the company’s revenue dynamics by analyzing its same-store sales, which show how much revenue its established locations generate. Over the last two years, Universal Health Services’s same-store sales averaged 4.3% year-on-year growth. Because this number is lower than its revenue growth, we can see the opening of new locations is boosting the company’s top-line performance. 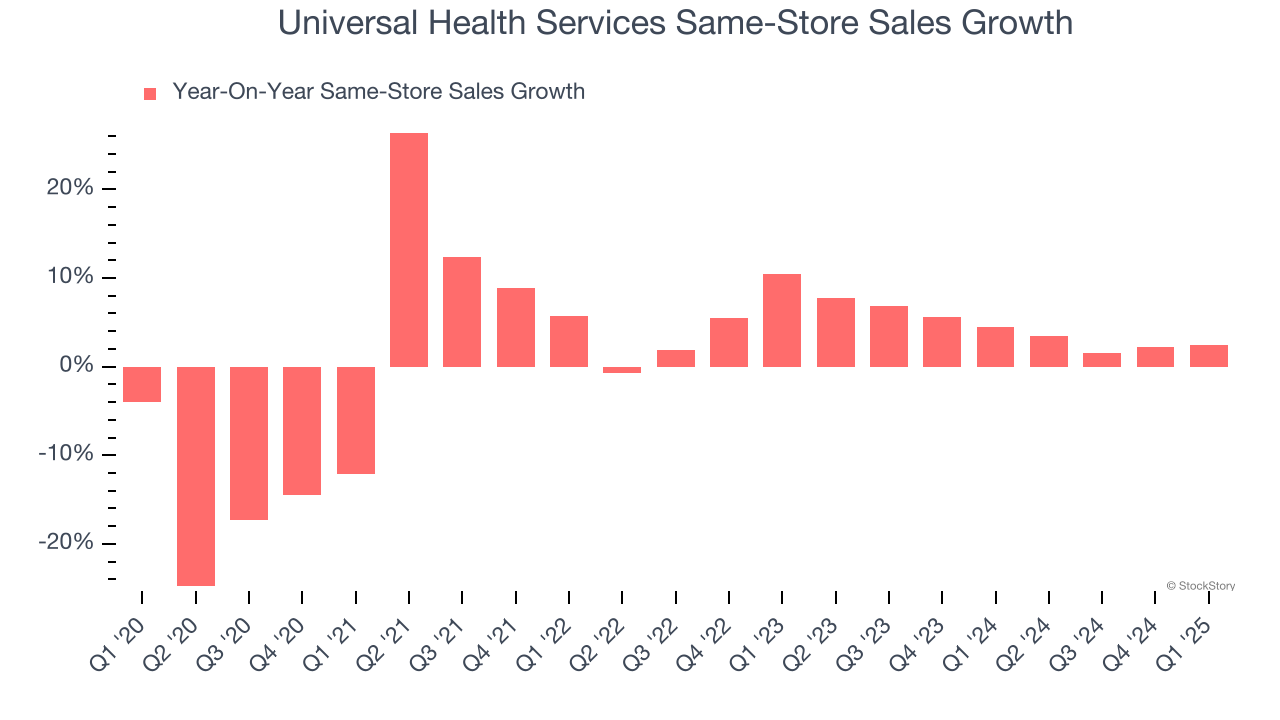
This quarter, Universal Health Services’s revenue grew by 6.7% year on year to $4.1 billion, missing Wall Street’s estimates.
Looking ahead, sell-side analysts expect revenue to grow 8% over the next 12 months, similar to its two-year rate. This projection is particularly healthy for a company of its scale and indicates the market is baking in success for its products and services.
Today’s young investors won’t have read the timeless lessons in Gorilla Game: Picking Winners In High Technology because it was written more than 20 years ago when Microsoft and Apple were first establishing their supremacy. But if we apply the same principles, then enterprise software stocks leveraging their own generative AI capabilities may well be the Gorillas of the future. So, in that spirit, we are excited to present our Special Free Report on a profitable, fast-growing enterprise software stock that is already riding the automation wave and looking to catch the generative AI next.
Operating Margin
Operating margin is one of the best measures of profitability because it tells us how much money a company takes home after subtracting all core expenses, like marketing and R&D.
Universal Health Services was profitable over the last five years but held back by its large cost base. Its average operating margin of 9.9% was weak for a healthcare business.
Analyzing the trend in its profitability, Universal Health Services’s operating margin decreased by 1.2 percentage points over the last five years, but it rose by 3.1 percentage points on a two-year basis. Still, shareholders will want to see Universal Health Services become more profitable in the future.
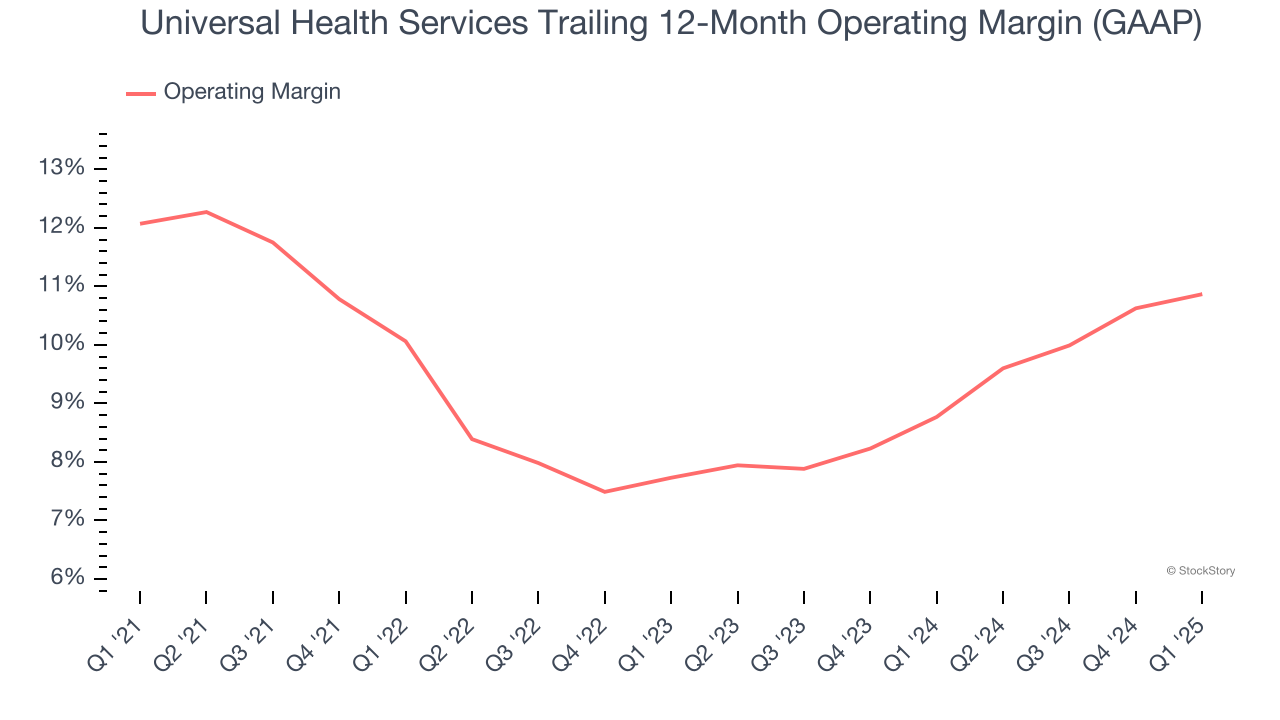
This quarter, Universal Health Services generated an operating profit margin of 11.1%, in line with the same quarter last year. This indicates the company’s overall cost structure has been relatively stable.
Earnings Per Share
We track the long-term change in earnings per share (EPS) for the same reason as long-term revenue growth. Compared to revenue, however, EPS highlights whether a company’s growth is profitable.
Universal Health Services’s EPS grew at an astounding 16.8% compounded annual growth rate over the last five years, higher than its 7.1% annualized revenue growth. However, this alone doesn’t tell us much about its business quality because its operating margin didn’t expand.
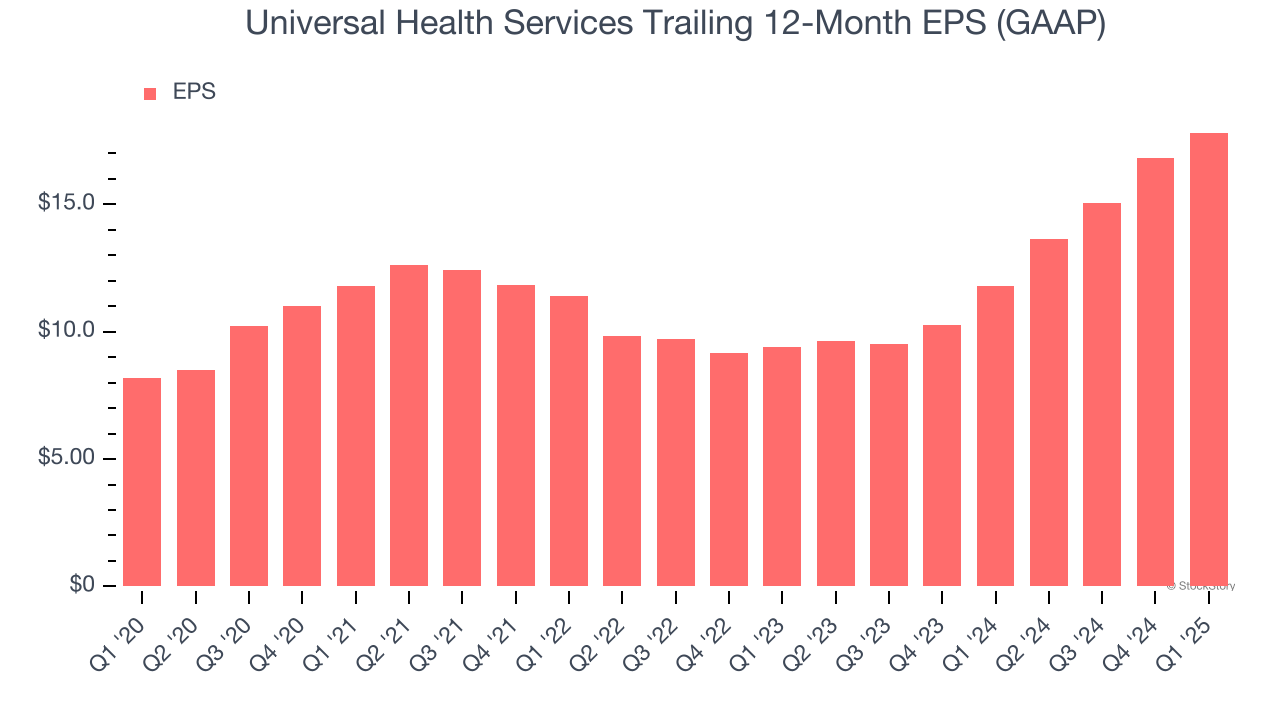
Diving into Universal Health Services’s quality of earnings can give us a better understanding of its performance. A five-year view shows that Universal Health Services has repurchased its stock, shrinking its share count by 24.9%. This tells us its EPS outperformed its revenue not because of increased operational efficiency but financial engineering, as buybacks boost per share earnings. 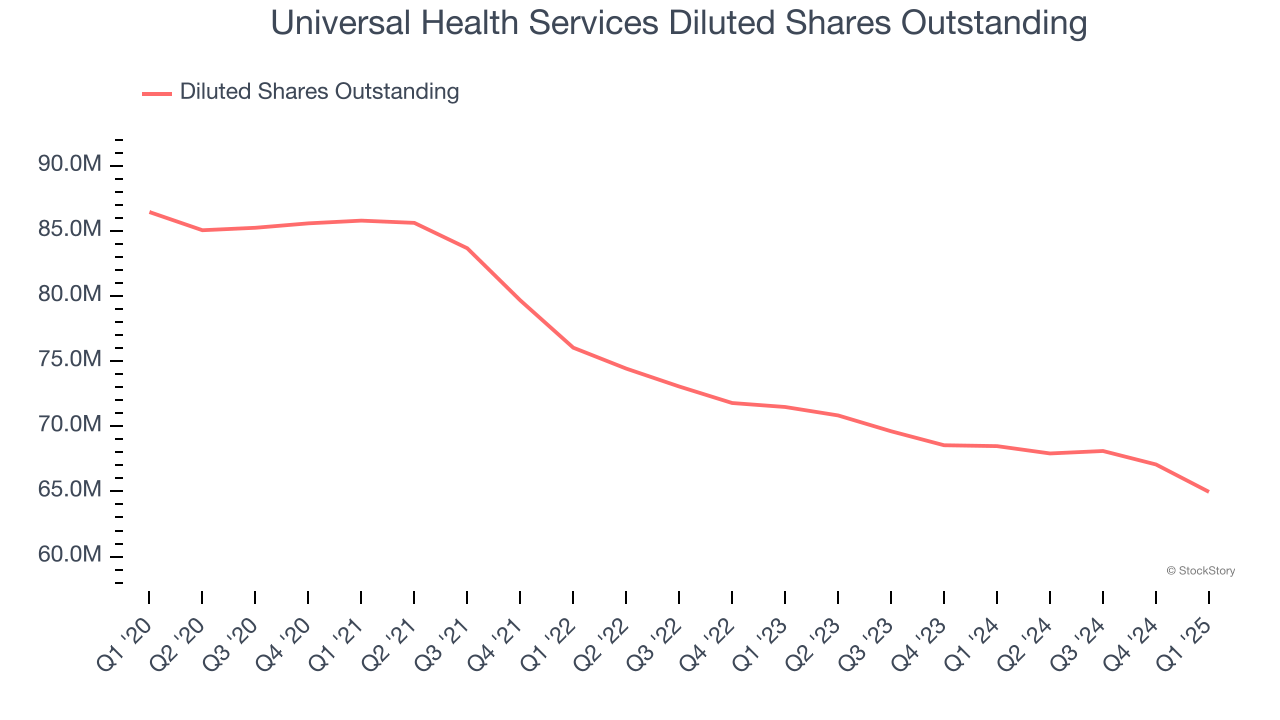
In Q1, Universal Health Services reported EPS at $4.80, up from $3.82 in the same quarter last year. This print beat analysts’ estimates by 8.9%. Over the next 12 months, Wall Street expects Universal Health Services’s full-year EPS of $17.82 to grow 9.3%.
Key Takeaways from Universal Health Services’s Q1 Results
It was encouraging to see Universal Health Services beat analysts’ EPS and EBITDA expectations this quarter. On the other hand, its revenue slightly missed due to softer-than-anticipated same-store sales. Overall, this was a weaker quarter. The stock traded down 3.3% to $167.50 immediately after reporting.
Universal Health Services’s earnings report left more to be desired. Let’s look forward to see if this quarter has created an opportunity to buy the stock. When making that decision, it’s important to consider its valuation, business qualities, as well as what has happened in the latest quarter. We cover that in our actionable full research report which you can read here, it’s free.