
Healthcare services company The Ensign Group (NASDAQ: ENSG). met Wall Street’s revenue expectations in Q1 CY2025, with sales up 16.1% year on year to $1.17 billion. Its non-GAAP profit of $1.52 per share was 1.9% above analysts’ consensus estimates.
Is now the time to buy The Ensign Group? Find out by accessing our full research report, it’s free.
The Ensign Group (ENSG) Q1 CY2025 Highlights:
- Revenue: $1.17 billion vs analyst estimates of $1.17 billion (16.1% year-on-year growth, in line)
- Adjusted EPS: $1.52 vs analyst estimates of $1.49 (1.9% beat)
- Adjusted EBITDA: $137.4 million vs analyst estimates of $133.7 million (11.7% margin, 2.8% beat)
- Operating Margin: 8.6%, in line with the same quarter last year
- Sales Volumes rose 12.5% year on year (10.1% in the same quarter last year)
- Market Capitalization: $7.32 billion
“We are thrilled to announce another record setting quarter achieved by our local teams. In spite of all the industry noise, our results this quarter demonstrate that we’ve never been stronger, showing yet again that sound fundamentals coupled with incredible passion can forge consistency even in an ever-changing environment. Our operators set several all-time highs during the quarter, which are only made possible by strong clinical outcomes achieved by our dedicated team of our caregivers and front-line staff,” said Barry Port, Ensign’s Chief Executive Officer.
Company Overview
Founded in 1999 and named after a naval term for a flag-bearing ship, The Ensign Group (NASDAQ: ENSG) operates skilled nursing facilities, senior living communities, and rehabilitation services across 15 states, primarily serving high-acuity patients recovering from various medical conditions.
Sales Growth
A company’s long-term sales performance can indicate its overall quality. Any business can experience short-term success, but top-performing ones enjoy sustained growth for years. Thankfully, The Ensign Group’s 15.5% annualized revenue growth over the last five years was solid. Its growth beat the average healthcare company and shows its offerings resonate with customers, a helpful starting point for our analysis.
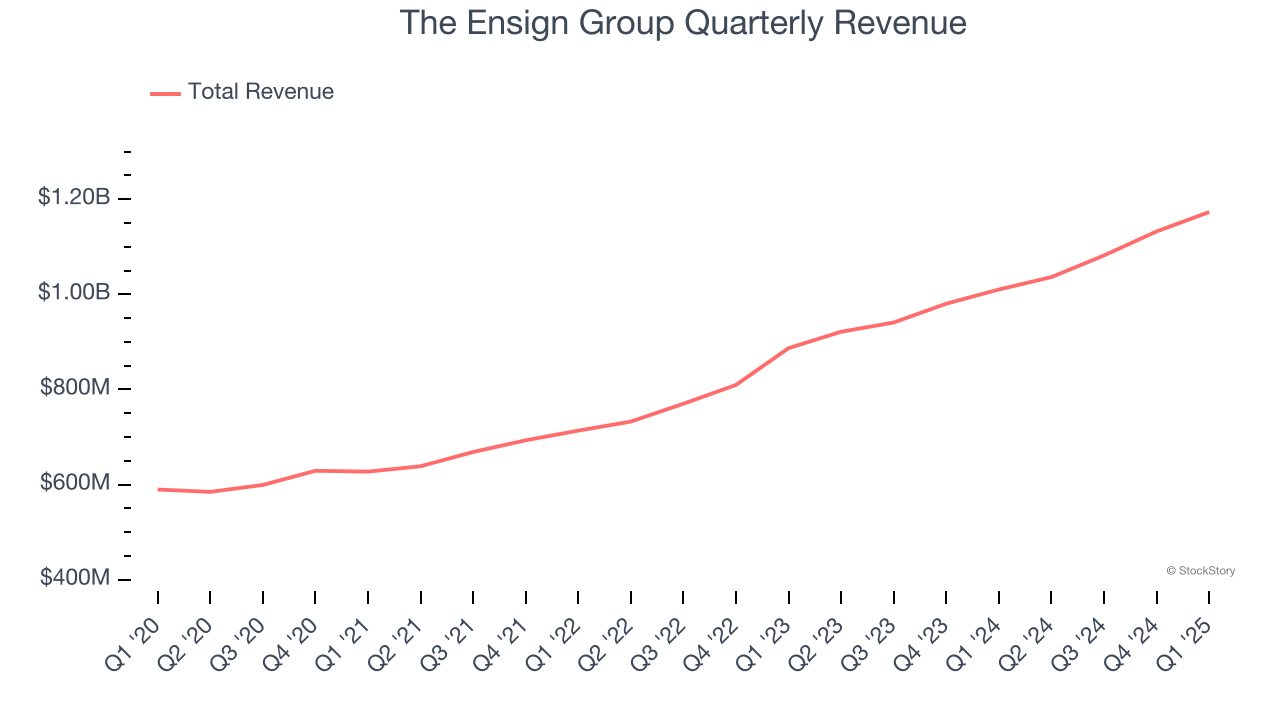
We at StockStory place the most emphasis on long-term growth, but within healthcare, a half-decade historical view may miss recent innovations or disruptive industry trends. The Ensign Group’s annualized revenue growth of 17.6% over the last two years is above its five-year trend, suggesting its demand was strong and recently accelerated. 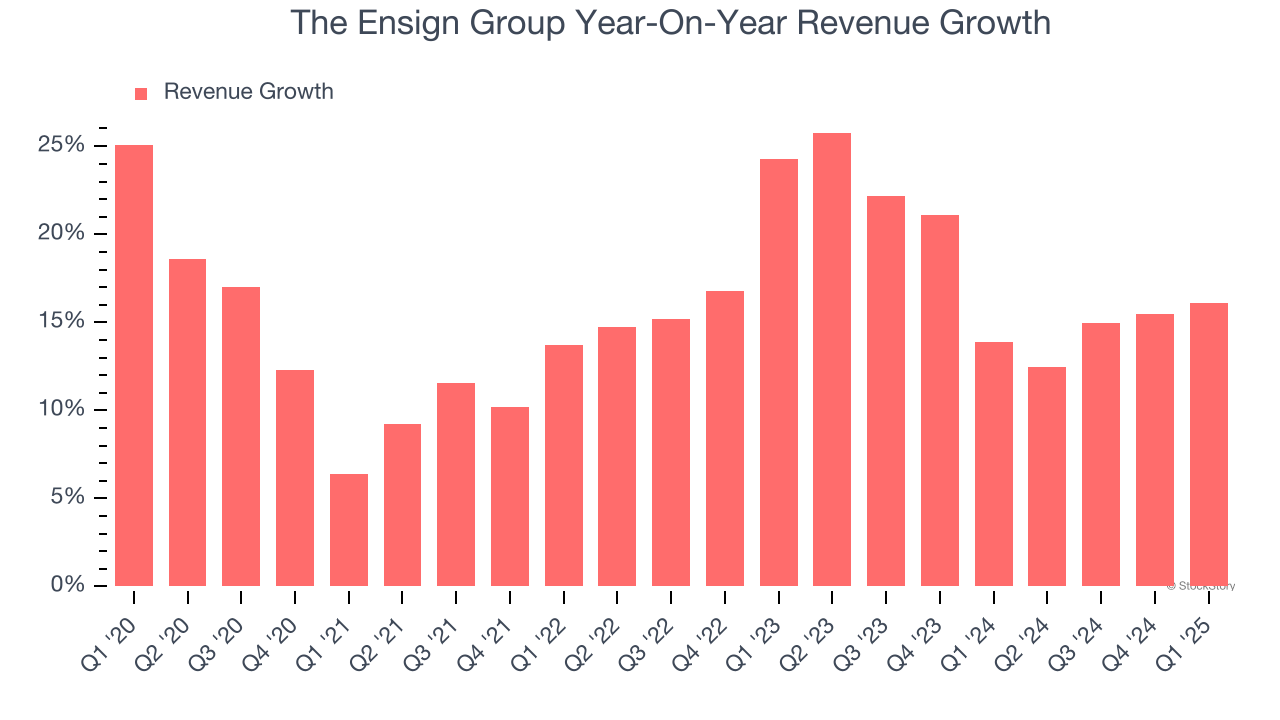
We can better understand the company’s revenue dynamics by analyzing its number of units sold, which reached 2.54 million in the latest quarter. Over the last two years, The Ensign Group’s units sold averaged 13.2% year-on-year growth. Because this number is lower than its revenue growth, we can see the company benefited from price increases. 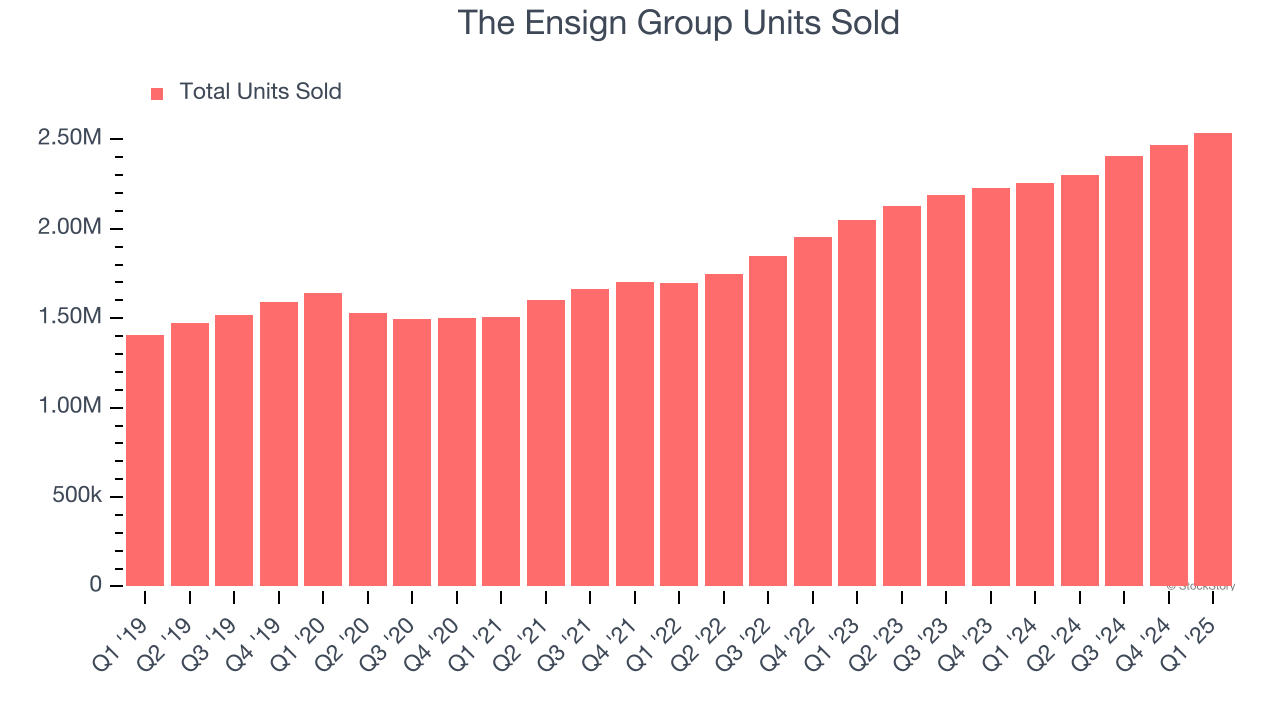
This quarter, The Ensign Group’s year-on-year revenue growth was 16.1%, and its $1.17 billion of revenue was in line with Wall Street’s estimates.
Looking ahead, sell-side analysts expect revenue to grow 12.8% over the next 12 months, a deceleration versus the last two years. Still, this projection is admirable and implies the market sees success for its products and services.
Software is eating the world and there is virtually no industry left that has been untouched by it. That drives increasing demand for tools helping software developers do their jobs, whether it be monitoring critical cloud infrastructure, integrating audio and video functionality, or ensuring smooth content streaming. Click here to access a free report on our 3 favorite stocks to play this generational megatrend.
Operating Margin
Operating margin is an important measure of profitability as it shows the portion of revenue left after accounting for all core expenses – everything from the cost of goods sold to advertising and wages. It’s also useful for comparing profitability across companies with different levels of debt and tax rates because it excludes interest and taxes.
The Ensign Group was profitable over the last five years but held back by its large cost base. Its average operating margin of 8.7% was weak for a healthcare business.
Analyzing the trend in its profitability, The Ensign Group’s operating margin might fluctuated slightly but has generally stayed the same over the last five years, meaning it will take a fundamental shift in the business model to change.
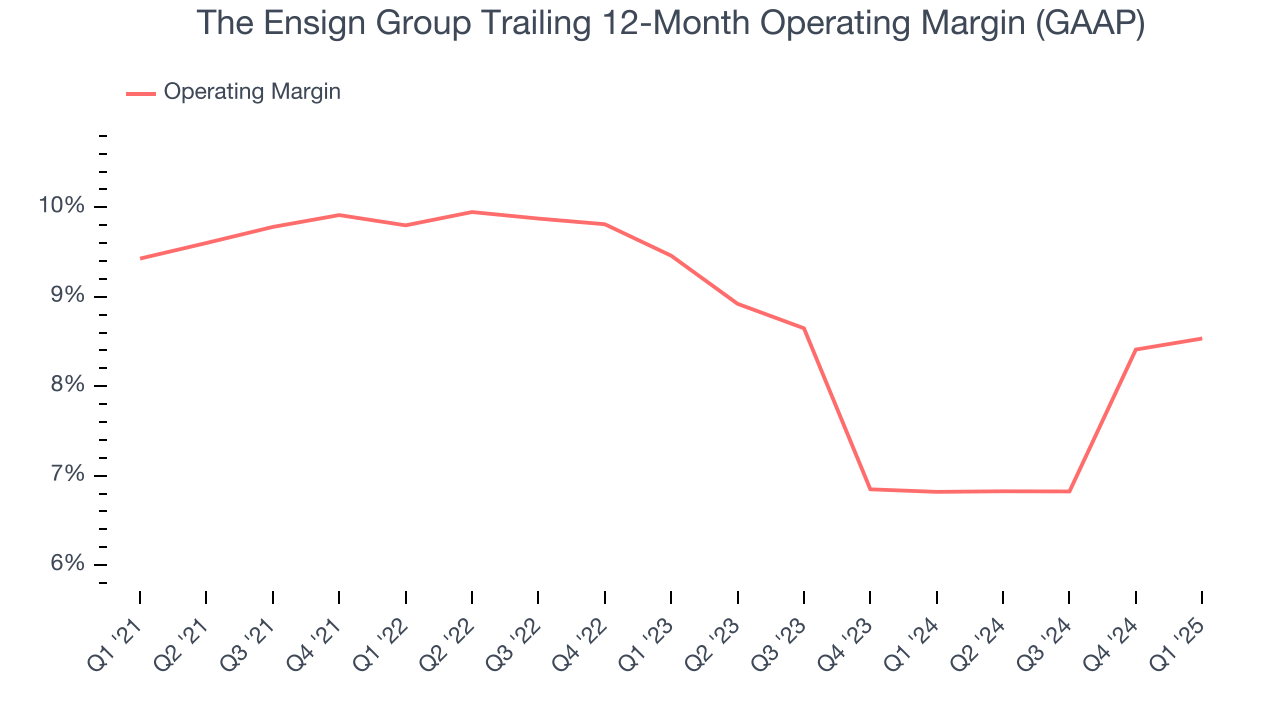
This quarter, The Ensign Group generated an operating profit margin of 8.6%, in line with the same quarter last year. This indicates the company’s overall cost structure has been relatively stable.
Earnings Per Share
Revenue trends explain a company’s historical growth, but the long-term change in earnings per share (EPS) points to the profitability of that growth – for example, a company could inflate its sales through excessive spending on advertising and promotions.
The Ensign Group’s EPS grew at an astounding 18.4% compounded annual growth rate over the last five years, higher than its 15.5% annualized revenue growth. However, we take this with a grain of salt because its operating margin didn’t expand and it didn’t repurchase its shares, meaning the delta came from reduced interest expenses or taxes.
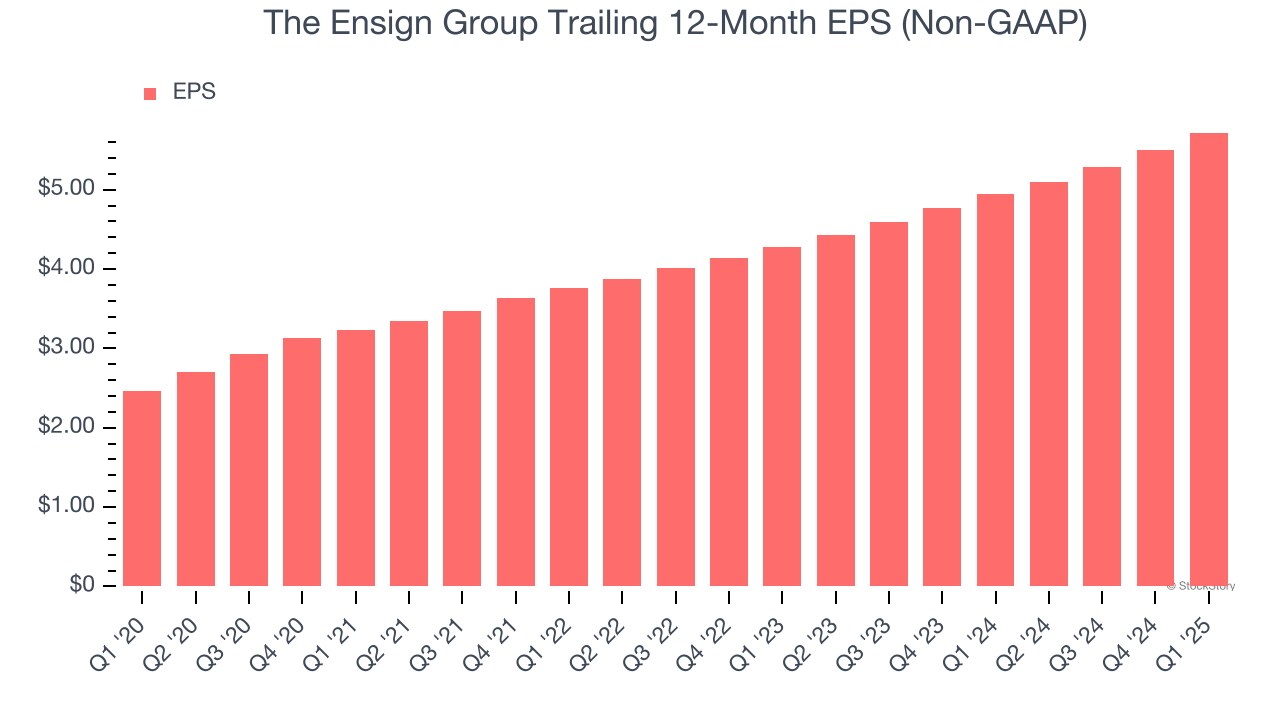
In Q1, The Ensign Group reported EPS at $1.52, up from $1.30 in the same quarter last year. This print beat analysts’ estimates by 1.9%. Over the next 12 months, Wall Street expects The Ensign Group’s full-year EPS of $5.72 to grow 12.7%.
Key Takeaways from The Ensign Group’s Q1 Results
It was good to see The Ensign Group narrowly top analysts’ sales volume expectations this quarter. EPS also beat. Overall, this quarter had some key positives. The stock remained flat at $129.42 immediately following the results.
Big picture, is The Ensign Group a buy here and now? What happened in the latest quarter matters, but not as much as longer-term business quality and valuation, when deciding whether to invest in this stock. We cover that in our actionable full research report which you can read here, it’s free.