
Electronic components manufacturer CTS Corporation (NYSE: CTS) fell short of the market’s revenue expectations in Q1 CY2025, with sales flat year on year at $125.8 million. On the other hand, the company’s outlook for the full year was close to analysts’ estimates with revenue guided to $535 million at the midpoint. Its non-GAAP profit of $0.44 per share was 10.2% below analysts’ consensus estimates.
Is now the time to buy CTS? Find out by accessing our full research report, it’s free.
CTS (CTS) Q1 CY2025 Highlights:
- Revenue: $125.8 million vs analyst estimates of $128.7 million (flat year on year, 2.3% miss)
- Adjusted EPS: $0.44 vs analyst expectations of $0.49 (10.2% miss)
- Adjusted EBITDA: $25.8 million vs analyst estimates of $27.05 million (20.5% margin, 4.6% miss)
- The company reconfirmed its revenue guidance for the full year of $535 million at the midpoint
- Management reiterated its full-year Adjusted EPS guidance of $2.28 at the midpoint
- Operating Margin: 12.9%, in line with the same quarter last year
- Free Cash Flow Margin: 8.7%, down from 11.4% in the same quarter last year
- Market Capitalization: $1.20 billion
“Our global teams continued to execute well in a challenging operating environment. We delivered double digit sales growth in our diversified markets,” said Kieran O’Sullivan, CEO of CTS Corporation.
Company Overview
With roots dating back to 1896 and a global manufacturing footprint, CTS (NYSE: CTS) designs and manufactures sensors, connectivity components, and actuators for aerospace, defense, industrial, medical, and transportation markets.
Sales Growth
A company’s long-term performance is an indicator of its overall quality. Any business can put up a good quarter or two, but many enduring ones grow for years.
With $515.8 million in revenue over the past 12 months, CTS is a small player in the business services space, which sometimes brings disadvantages compared to larger competitors benefiting from economies of scale and numerous distribution channels.
As you can see below, CTS grew its sales at a sluggish 2.6% compounded annual growth rate over the last five years. This shows it failed to generate demand in any major way and is a rough starting point for our analysis.
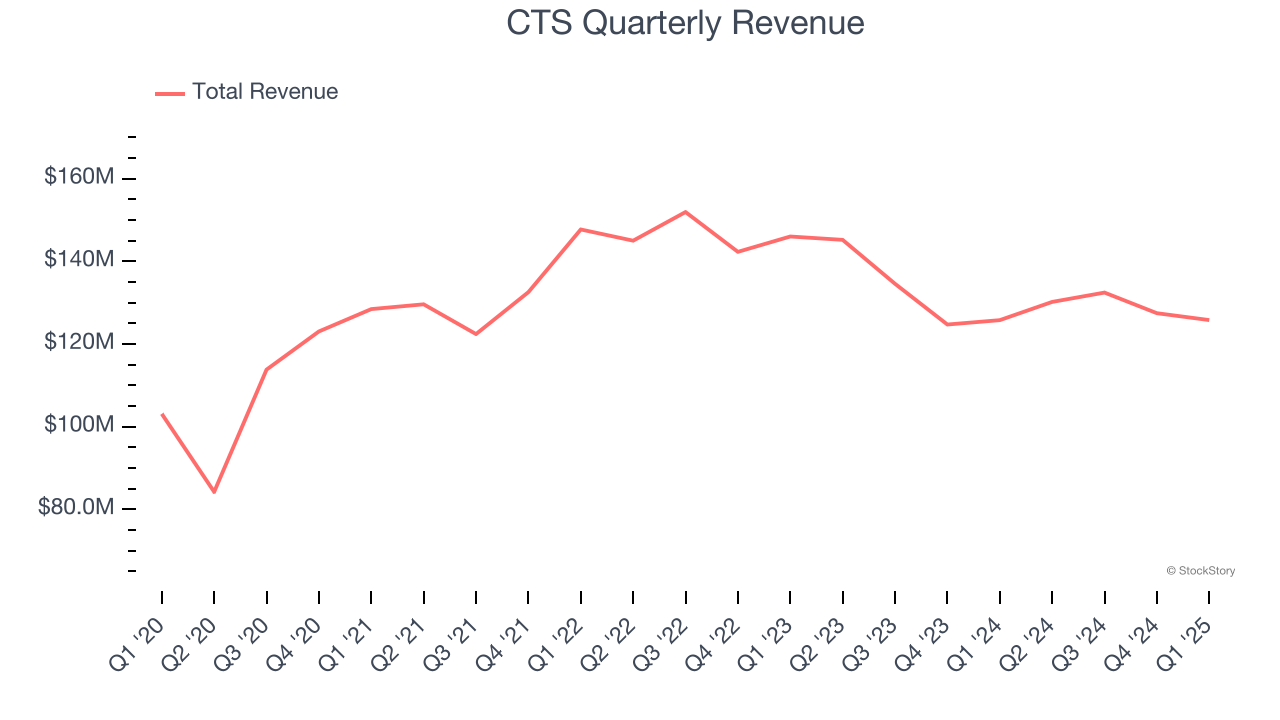
Long-term growth is the most important, but within business services, a half-decade historical view may miss new innovations or demand cycles. CTS’s performance shows it grew in the past but relinquished its gains over the last two years, as its revenue fell by 6.1% annually. 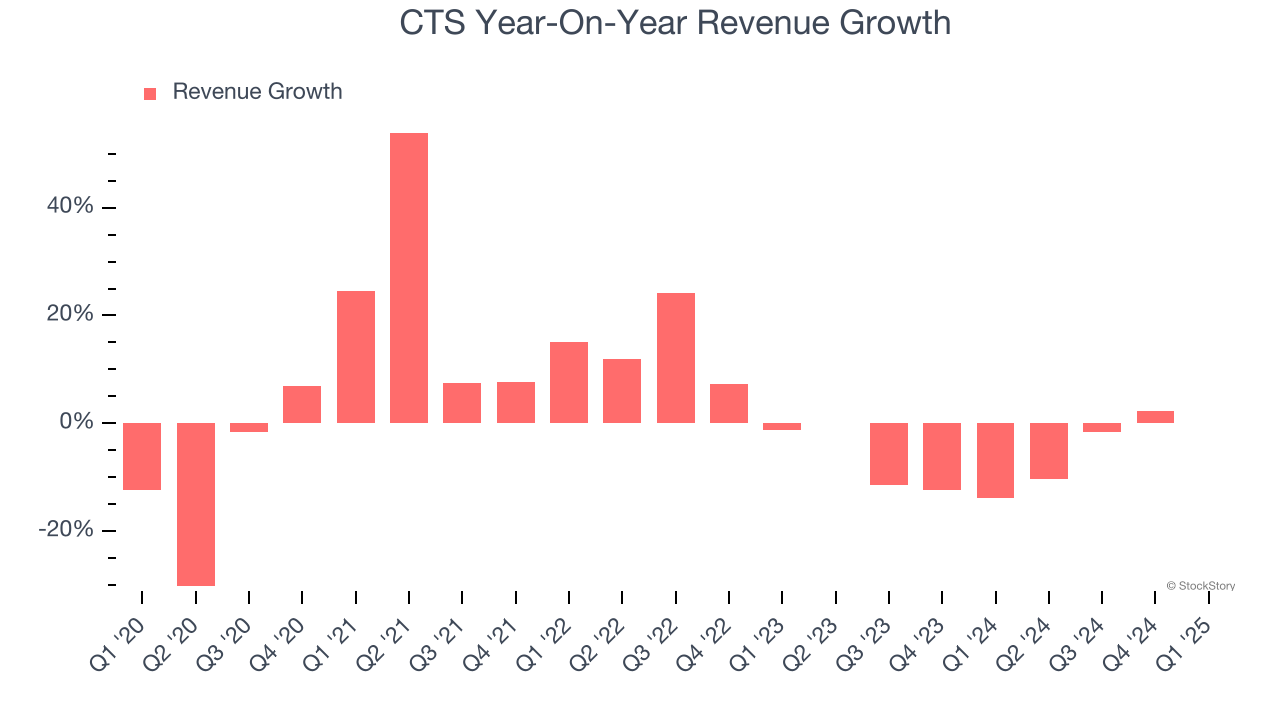
This quarter, CTS’s $125.8 million of revenue was flat year on year, falling short of Wall Street’s estimates.
Looking ahead, sell-side analysts expect revenue to grow 5.5% over the next 12 months, an improvement versus the last two years. This projection is above average for the sector and suggests its newer products and services will spur better top-line performance.
Here at StockStory, we certainly understand the potential of thematic investing. Diverse winners from Microsoft (MSFT) to Alphabet (GOOG), Coca-Cola (KO) to Monster Beverage (MNST) could all have been identified as promising growth stories with a megatrend driving the growth. So, in that spirit, we’ve identified a relatively under-the-radar profitable growth stock benefiting from the rise of AI, available to you FREE via this link.
Operating Margin
Operating margin is a key measure of profitability. Think of it as net income - the bottom line - excluding the impact of taxes and interest on debt, which are less connected to business fundamentals.
CTS has been an efficient company over the last five years. It was one of the more profitable businesses in the business services sector, boasting an average operating margin of 14.7%.
Analyzing the trend in its profitability, CTS’s operating margin rose by 3 percentage points over the last five years, as its sales growth gave it operating leverage.
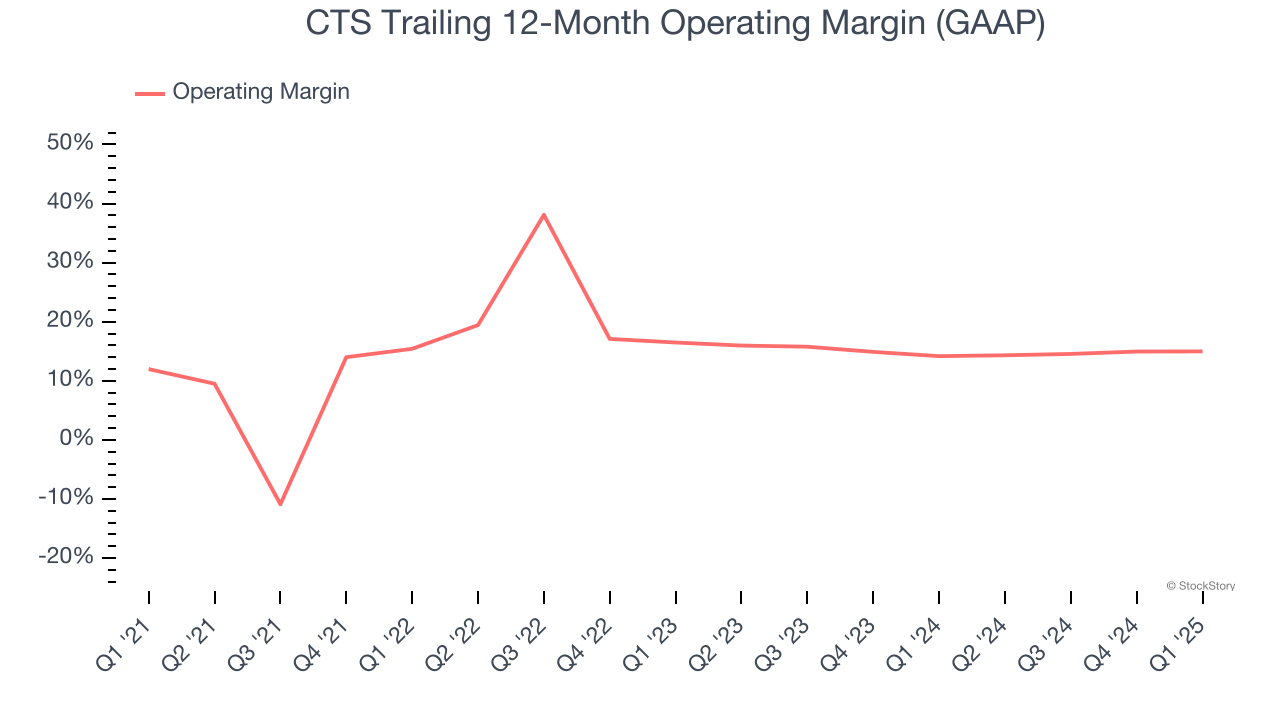
In Q1, CTS generated an operating profit margin of 12.9%, in line with the same quarter last year. This indicates the company’s overall cost structure has been relatively stable.
Earnings Per Share
We track the long-term change in earnings per share (EPS) for the same reason as long-term revenue growth. Compared to revenue, however, EPS highlights whether a company’s growth is profitable.
CTS’s EPS grew at a remarkable 11.4% compounded annual growth rate over the last five years, higher than its 2.6% annualized revenue growth. This tells us the company became more profitable on a per-share basis as it expanded.
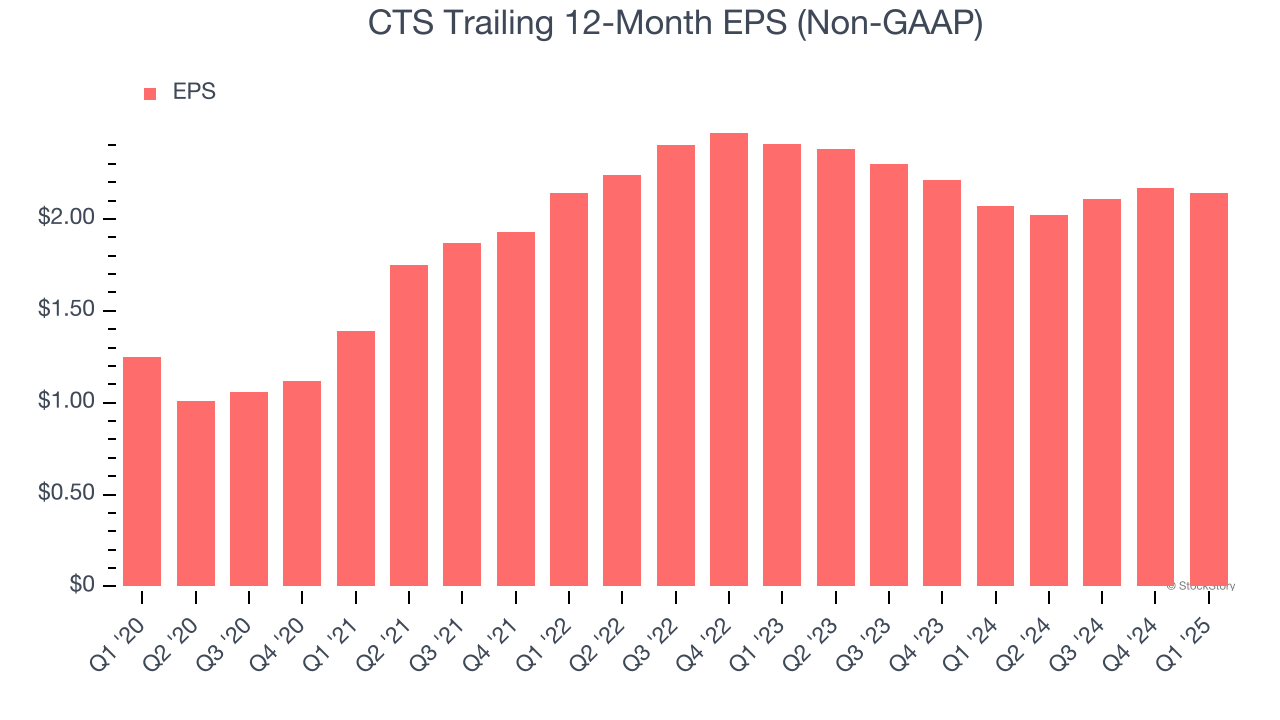
Diving into the nuances of CTS’s earnings can give us a better understanding of its performance. As we mentioned earlier, CTS’s operating margin was flat this quarter but expanded by 3 percentage points over the last five years. On top of that, its share count shrank by 7.5%. These are positive signs for shareholders because improving profitability and share buybacks turbocharge EPS growth relative to revenue growth. 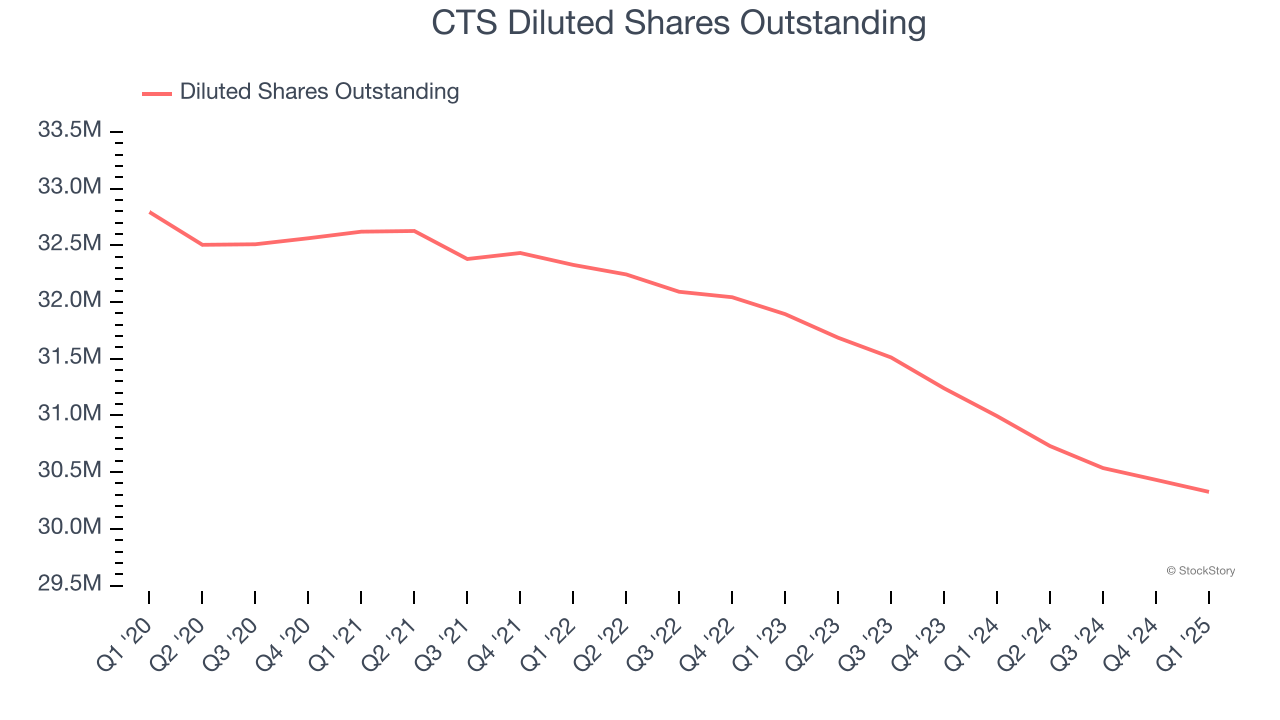
In Q1, CTS reported EPS at $0.44, down from $0.47 in the same quarter last year. This print missed analysts’ estimates, but we care more about long-term EPS growth than short-term movements. Over the next 12 months, Wall Street expects CTS’s full-year EPS of $2.14 to grow 1.4%.
Key Takeaways from CTS’s Q1 Results
We were impressed by how significantly CTS blew past analysts’ full-year EPS guidance expectations this quarter. On the other hand, its revenue, EPS, and EBITDA fell short of Wall Street’s estimates. Overall, this quarter could have been better. The stock remained flat at $39.89 immediately following the results.
Is CTS an attractive investment opportunity at the current price? If you’re making that decision, you should consider the bigger picture of valuation, business qualities, as well as the latest earnings. We cover that in our actionable full research report which you can read here, it’s free.