Chicken producer Pilgrim’s Pride (NASDAQ: PPC) fell short of the market’s revenue expectations in Q1 CY2025 as sales rose 2.3% year on year to $4.46 billion. Its non-GAAP profit of $1.31 per share was 2.2% below analysts’ consensus estimates.
Is now the time to buy Pilgrim's Pride? Find out by accessing our full research report, it’s free.
Pilgrim's Pride (PPC) Q1 CY2025 Highlights:
- Revenue: $4.46 billion vs analyst estimates of $4.54 billion (2.3% year-on-year growth, 1.6% miss)
- Adjusted EPS: $1.31 vs analyst expectations of $1.34 (2.2% miss)
- Adjusted EBITDA: $533.2 million vs analyst estimates of $552.8 million (11.9% margin, 3.5% miss)
- Operating Margin: 9.1%, up from 5.7% in the same quarter last year
- Free Cash Flow Margin: 0.6%, down from 3.7% in the same quarter last year
- Market Capitalization: $12.81 billion
“While facing volatility during the quarter, we maintained our focus on controlling the controllables and consistent execution of our strategies,” said Fabio Sandri, Pilgrim’s President and CEO.
Company Overview
Offering everything from pre-marinated to frozen chicken, Pilgrim’s Pride (NASDAQ: PPC) produces, processes, and distributes chicken products to retailers and food service customers.
Sales Growth
A company’s long-term performance is an indicator of its overall quality. Any business can put up a good quarter or two, but the best consistently grow over the long haul.
With $17.98 billion in revenue over the past 12 months, Pilgrim's Pride is larger than most consumer staples companies and benefits from economies of scale, enabling it to gain more leverage on its fixed costs than smaller competitors. Its size also gives it negotiating leverage with distributors, allowing its products to reach more shelves. However, its scale is a double-edged sword because there are only so many big store chains to sell into, making it harder to find incremental growth. To accelerate sales, Pilgrim's Pride likely needs to optimize its pricing or lean into new products and international expansion.
As you can see below, Pilgrim's Pride’s 4.5% annualized revenue growth over the last three years was tepid. This shows it failed to generate demand in any major way and is a rough starting point for our analysis.
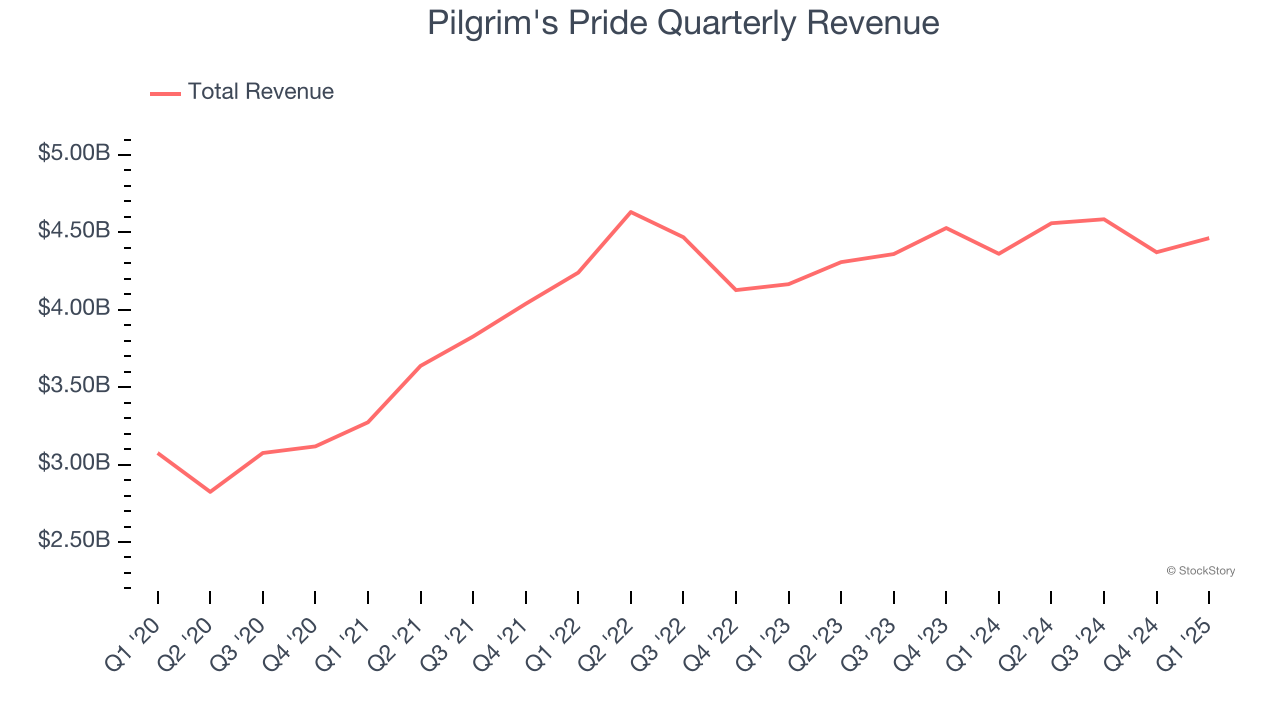
This quarter, Pilgrim's Pride’s revenue grew by 2.3% year on year to $4.46 billion, falling short of Wall Street’s estimates.
Looking ahead, sell-side analysts expect revenue to remain flat over the next 12 months, a deceleration versus the last three years. This projection is underwhelming and indicates its products will face some demand challenges.
Here at StockStory, we certainly understand the potential of thematic investing. Diverse winners from Microsoft (MSFT) to Alphabet (GOOG), Coca-Cola (KO) to Monster Beverage (MNST) could all have been identified as promising growth stories with a megatrend driving the growth. So, in that spirit, we’ve identified a relatively under-the-radar profitable growth stock benefiting from the rise of AI, available to you FREE via this link.
Cash Is King
Although earnings are undoubtedly valuable for assessing company performance, we believe cash is king because you can’t use accounting profits to pay the bills.
Pilgrim's Pride has shown decent cash profitability, giving it some flexibility to reinvest or return capital to investors. The company’s free cash flow margin averaged 5.5% over the last two years, slightly better than the broader consumer staples sector.
Taking a step back, we can see that Pilgrim's Pride’s margin expanded by 4.3 percentage points over the last year. This is encouraging because it gives the company more optionality.
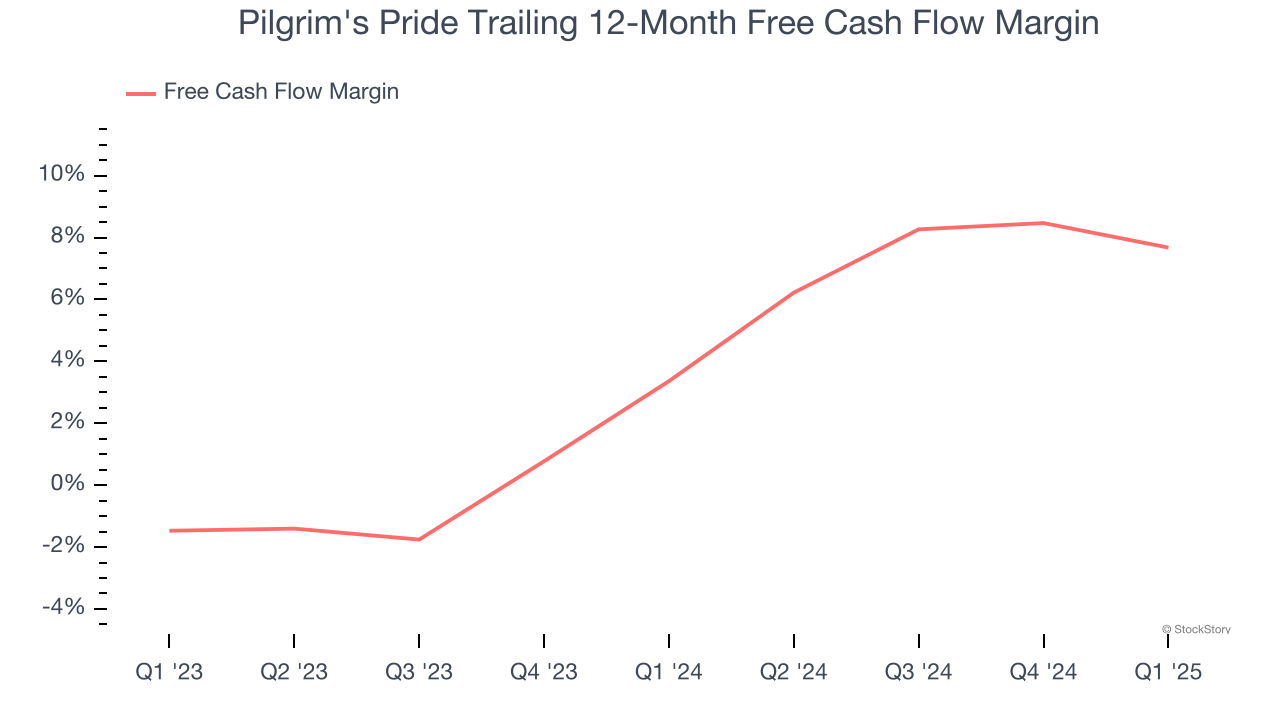
Pilgrim's Pride broke even from a free cash flow perspective in Q1. The company’s cash profitability regressed as it was 3.1 percentage points lower than in the same quarter last year. This warrants extra attention because consumer staples companies typically produce more consistent and defensive performance.
Key Takeaways from Pilgrim's Pride’s Q1 Results
We struggled to find many positives in these results. Its EBITDA missed and its gross margin fell short of Wall Street’s estimates. Overall, this was a weaker quarter. The stock traded down 6.6% to $51 immediately following the results.
The latest quarter from Pilgrim's Pride’s wasn’t that good. One earnings report doesn’t define a company’s quality, though, so let’s explore whether the stock is a buy at the current price. The latest quarter does matter, but not nearly as much as longer-term fundamentals and valuation, when deciding if the stock is a buy. We cover that in our actionable full research report which you can read here, it’s free.