
Engineering and design software provider PTC (NASDAQ: PTC) beat Wall Street’s revenue expectations in Q1 CY2025, with sales up 5.5% year on year to $636.4 million. Revenue guidance for the full year exceeded analysts’ estimates, but next quarter’s guidance of $580 million was less impressive, coming in 5.5% below expectations. Its GAAP profit of $1.35 per share was 48.4% above analysts’ consensus estimates.
Is now the time to buy PTC? Find out by accessing our full research report, it’s free.
PTC (PTC) Q1 CY2025 Highlights:
- Revenue: $636.4 million vs analyst estimates of $606 million (5.5% year-on-year growth, 5% beat)
- EPS (GAAP): $1.35 vs analyst estimates of $0.91 (48.4% beat)
- Adjusted Operating Income: $299.3 million vs analyst estimates of $249.8 million (47% margin, 19.8% beat)
- The company lifted its revenue guidance for the full year to $2.51 billion at the midpoint from $2.48 billion, a 1% increase
- Operating Margin: 35.1%, up from 29.8% in the same quarter last year
- Free Cash Flow Margin: 43.8%, up from 41.7% in the previous quarter
- Annual Recurring Revenue: $2.29 billion at quarter end, up 9.6% year on year
- Market Capitalization: $18.49 billion
"Q2 was a solid quarter for us, and I remain extremely optimistic about our position as an enabler of the digital economy – particularly our position as a supplier of software tools that make our customers more efficient as they design, manufacture, and service their products," said Neil Barua, President and CEO, PTC.
Company Overview
Used to design the Airbus A380 and Boeing 787 Dreamliner commercial airplanes, PTC’s (NASDAQ: PTC) software-as-service platform helps engineers and designers create and test products before manufacturing.
Sales Growth
Examining a company’s long-term performance can provide clues about its quality. Any business can have short-term success, but a top-tier one grows for years. Regrettably, PTC’s sales grew at a weak 7.7% compounded annual growth rate over the last three years. This fell short of our benchmark for the software sector and is a poor baseline for our analysis.
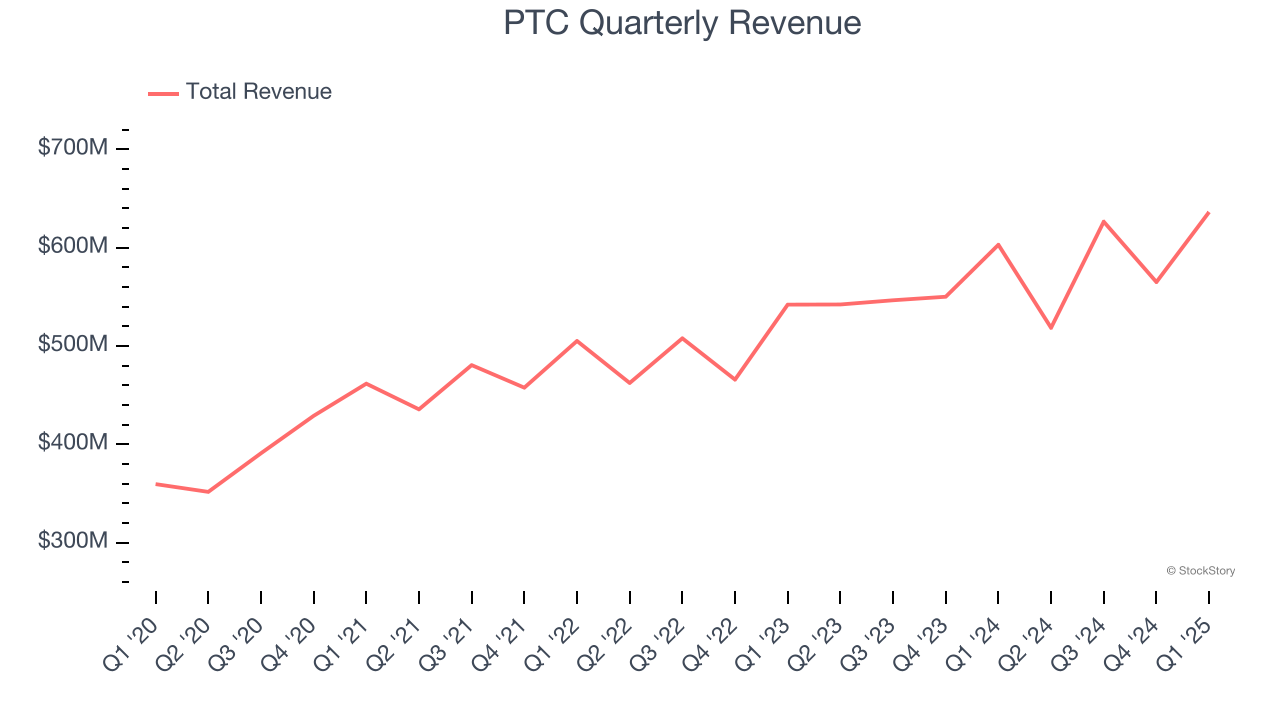
This quarter, PTC reported year-on-year revenue growth of 5.5%, and its $636.4 million of revenue exceeded Wall Street’s estimates by 5%. Company management is currently guiding for a 11.8% year-on-year increase in sales next quarter.
Looking further ahead, sell-side analysts expect revenue to grow 11.5% over the next 12 months, an acceleration versus the last three years. This projection is above average for the sector and suggests its newer products and services will spur better top-line performance.
Software is eating the world and there is virtually no industry left that has been untouched by it. That drives increasing demand for tools helping software developers do their jobs, whether it be monitoring critical cloud infrastructure, integrating audio and video functionality, or ensuring smooth content streaming. Click here to access a free report on our 3 favorite stocks to play this generational megatrend.
Annual Recurring Revenue
While reported revenue for a software company can include low-margin items like implementation fees, annual recurring revenue (ARR) is a sum of the next 12 months of contracted revenue purely from software subscriptions, or the high-margin, predictable revenue streams that make SaaS businesses so valuable.
PTC’s ARR punched in at $2.29 billion in Q1, and over the last four quarters, its growth slightly outpaced the sector as it averaged 10.3% year-on-year increases. This alternate topline metric grew faster than total sales, which likely means that the recurring portions of the business are growing faster than less predictable, choppier ones such as implementation fees. That could be a good sign for future revenue growth. 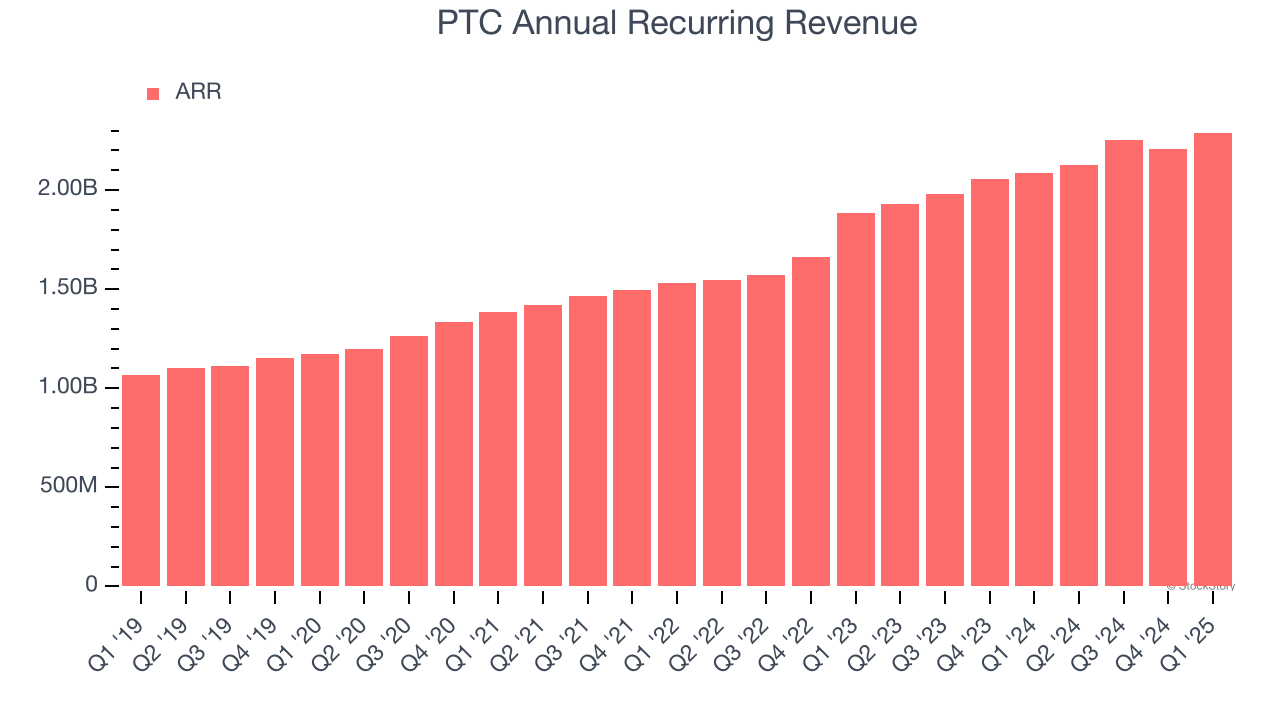
Customer Acquisition Efficiency
The customer acquisition cost (CAC) payback period represents the months required to recover the cost of acquiring a new customer. Essentially, it’s the break-even point for sales and marketing investments. A shorter CAC payback period is ideal, as it implies better returns on investment and business scalability.
PTC’s recent customer acquisition efforts haven’t yielded returns as its CAC payback period was negative this quarter, meaning its incremental sales and marketing investments outpaced its revenue. The company’s inefficiency indicates it operates in a competitive market and must continue investing to grow.
Key Takeaways from PTC’s Q1 Results
We enjoyed seeing PTC beat analysts’ revenue and adjusted operating income expectations this quarter. We were also glad its full-year revenue guidance slightly exceeded Wall Street’s estimates. Overall, this quarter was decent. The stock traded up 2.1% to $158 immediately following the results.
Should you buy the stock or not? What happened in the latest quarter matters, but not as much as longer-term business quality and valuation, when deciding whether to invest in this stock. We cover that in our actionable full research report which you can read here, it’s free.


