Commercial vehicle retailer Rush Enterprises (NASDAQ: RUSH.A) reported Q1 CY2025 results beating Wall Street’s revenue expectations, but sales fell by 1.1% year on year to $1.85 billion. Its GAAP profit of $0.73 per share was 1.4% above analysts’ consensus estimates.
Is now the time to buy Rush Enterprises? Find out by accessing our full research report, it’s free.
Rush Enterprises (RUSHA) Q1 CY2025 Highlights:
- Revenue: $1.85 billion vs analyst estimates of $1.83 billion (1.1% year-on-year decline, 1.4% beat)
- EPS (GAAP): $0.73 vs analyst estimates of $0.72 (1.4% beat)
- Adjusted EBITDA: $109.1 million vs analyst estimates of $146.4 million (5.9% margin, 25.4% miss)
- Operating Margin: 5%, in line with the same quarter last year
- Market Capitalization: $4.22 billion
“In the first quarter of 2025, the challenges that have plagued the industry for some time – the ongoing freight recession and general economic uncertainty, were exacerbated by mounting concerns related to U.S. trade policy, tariffs, and uncertainty around emissions regulations, causing many customers to take a cautious approach to their vehicle acquisition strategies. Consequently, new Class 8 truck demand softened significantly. However, as a result of our continued focus on our strategic initiatives and diversified customer base, we managed to slightly outperform the industry in the first quarter. As we have demonstrated over the past several quarters, the strength of our sales to vocational and public sector customers helped somewhat offset the sluggishness from our over-the-road customers,” said W.M. “Rusty” Rush, Chairman, Chief Executive Officer and President of Rush Enterprises,
Company Overview
Headquartered in Texas, Rush Enterprises (NASDAQ: RUSH.A) provides truck-related services and solutions, including sales, leasing, parts, and maintenance for commercial vehicles.
Sales Growth
Reviewing a company’s long-term sales performance reveals insights into its quality. Any business can have short-term success, but a top-tier one grows for years. Unfortunately, Rush Enterprises’s 6.3% annualized revenue growth over the last five years was mediocre. This fell short of our benchmark for the industrials sector and is a rough starting point for our analysis.
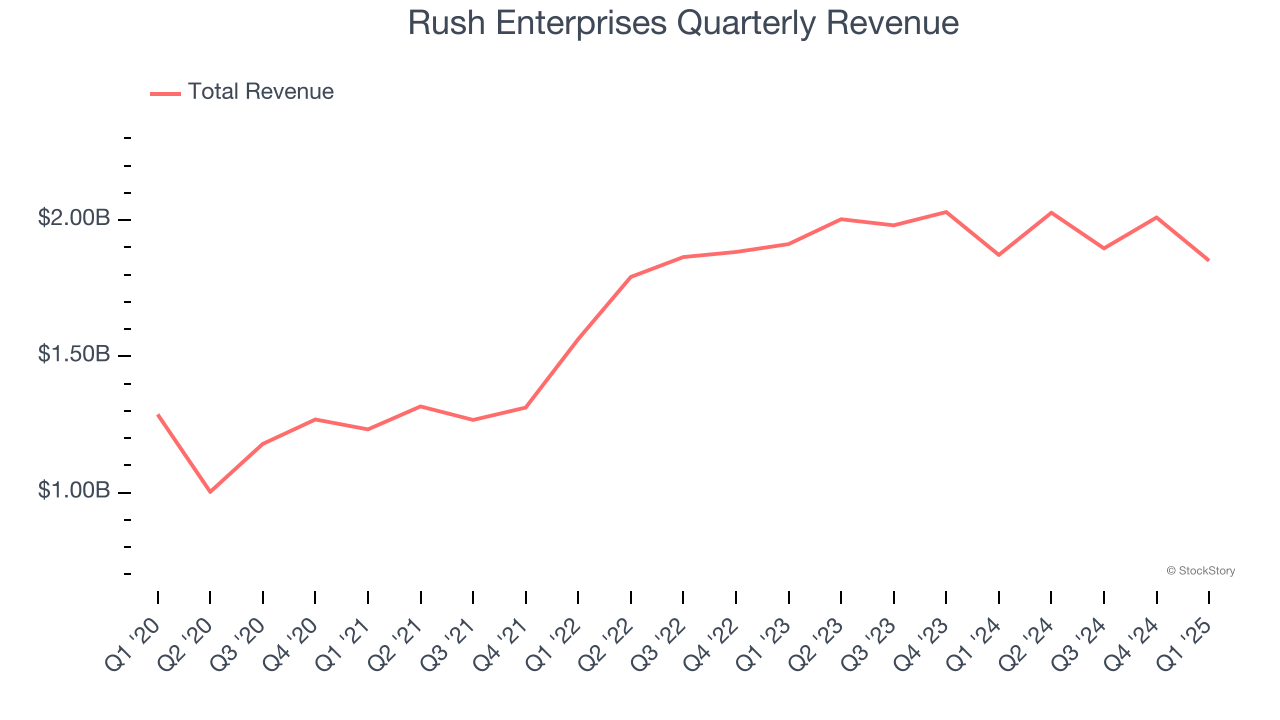
Long-term growth is the most important, but within industrials, a half-decade historical view may miss new industry trends or demand cycles. Rush Enterprises’s recent performance shows its demand has slowed as its annualized revenue growth of 2.2% over the last two years was below its five-year trend. 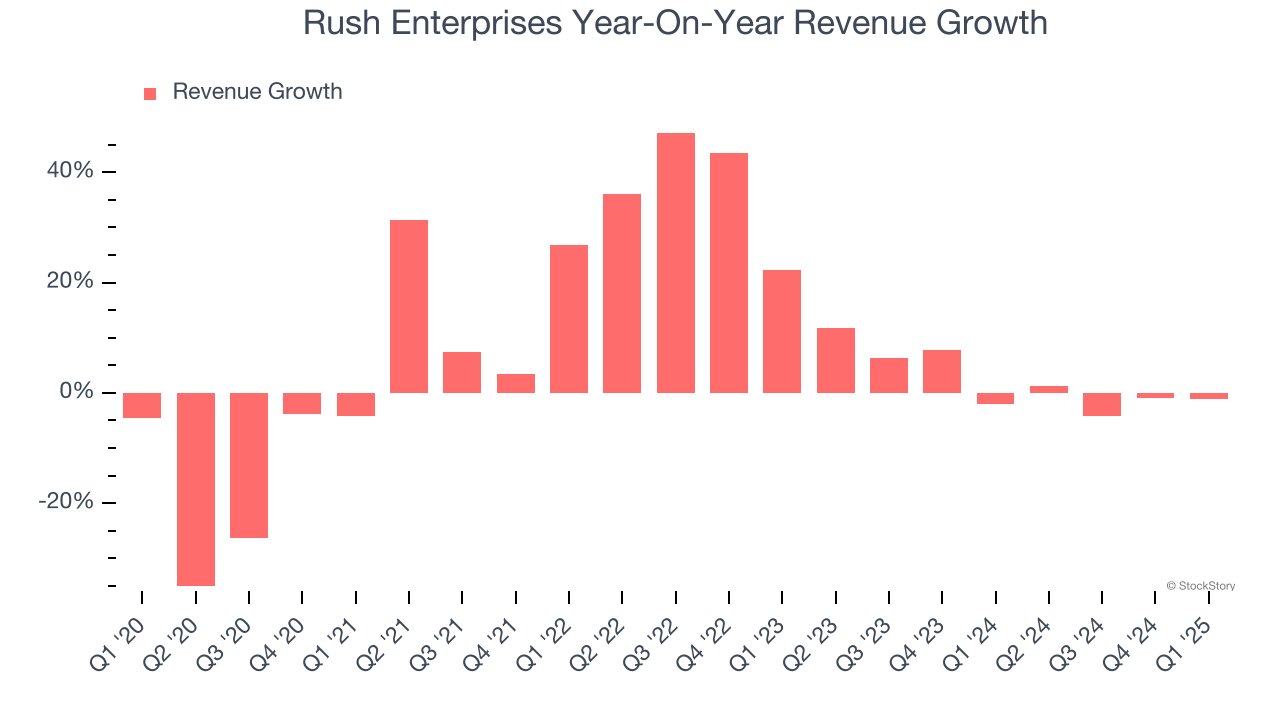
Rush Enterprises also breaks out the revenue for its most important segments, Vehicles and Aftermarket, which are 61.1% and 33.4% of revenue. Over the last two years, Rush Enterprises’s Vehicles revenue (new and used commercial trucks) averaged 3.5% year-on-year growth while its Aftermarket revenue (parts and services) was flat.
This quarter, Rush Enterprises’s revenue fell by 1.1% year on year to $1.85 billion but beat Wall Street’s estimates by 1.4%.
Looking ahead, sell-side analysts expect revenue to grow 2.3% over the next 12 months, similar to its two-year rate. This projection is underwhelming and indicates its newer products and services will not catalyze better top-line performance yet.
Unless you’ve been living under a rock, it should be obvious by now that generative AI is going to have a huge impact on how large corporations do business. While Nvidia and AMD are trading close to all-time highs, we prefer a lesser-known (but still profitable) stock benefiting from the rise of AI. Click here to access our free report one of our favorites growth stories.
Operating Margin
Rush Enterprises was profitable over the last five years but held back by its large cost base. Its average operating margin of 6% was weak for an industrials business. This result isn’t too surprising given its low gross margin as a starting point.
On the plus side, Rush Enterprises’s operating margin rose by 2 percentage points over the last five years, as its sales growth gave it operating leverage.
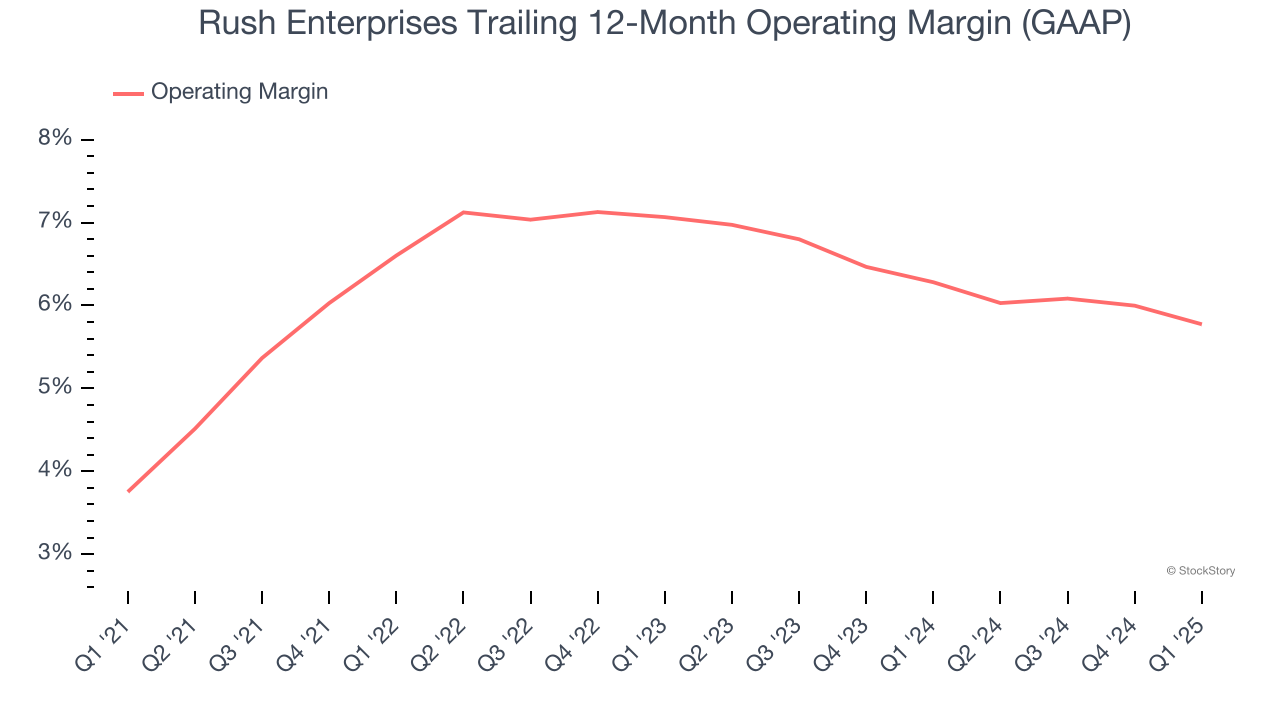
In Q1, Rush Enterprises generated an operating profit margin of 5%, in line with the same quarter last year. This indicates the company’s cost structure has recently been stable.
Earnings Per Share
We track the long-term change in earnings per share (EPS) for the same reason as long-term revenue growth. Compared to revenue, however, EPS highlights whether a company’s growth is profitable.
Rush Enterprises’s EPS grew at an astounding 18.8% compounded annual growth rate over the last five years, higher than its 6.3% annualized revenue growth. This tells us the company became more profitable on a per-share basis as it expanded.
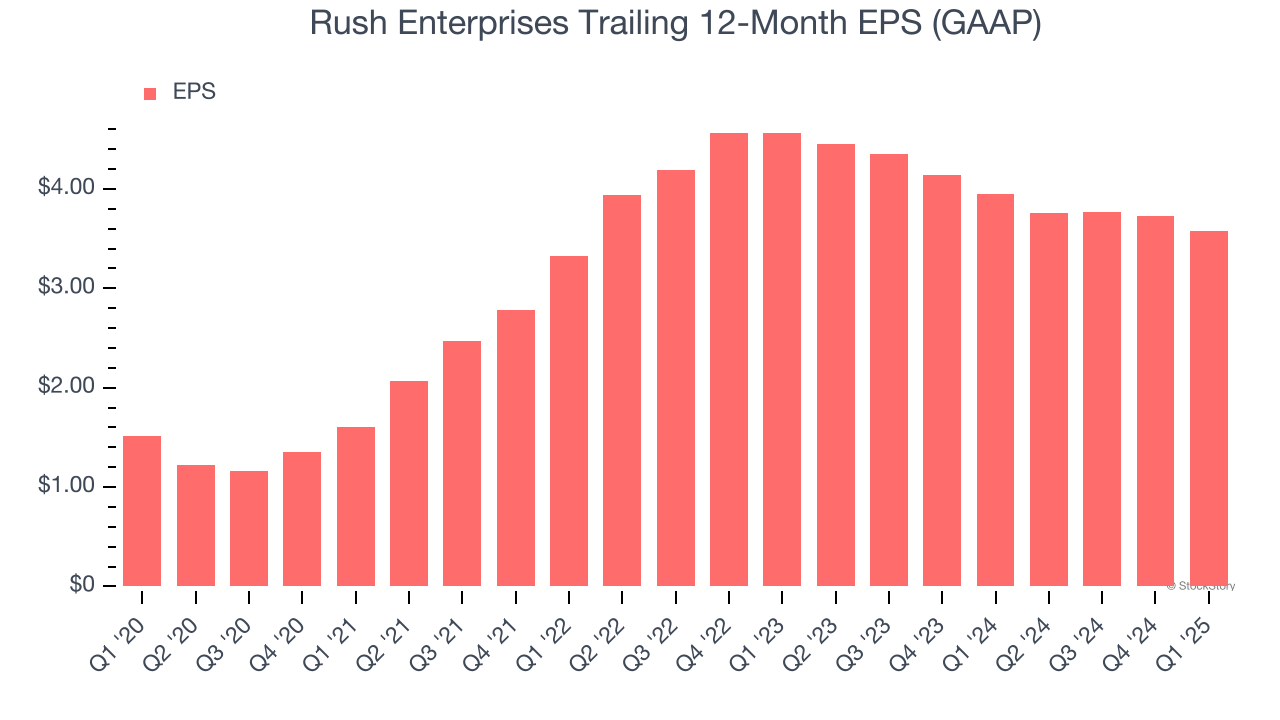
Diving into the nuances of Rush Enterprises’s earnings can give us a better understanding of its performance. As we mentioned earlier, Rush Enterprises’s operating margin was flat this quarter but expanded by 2 percentage points over the last five years. On top of that, its share count shrank by 1.9%. These are positive signs for shareholders because improving profitability and share buybacks turbocharge EPS growth relative to revenue growth. 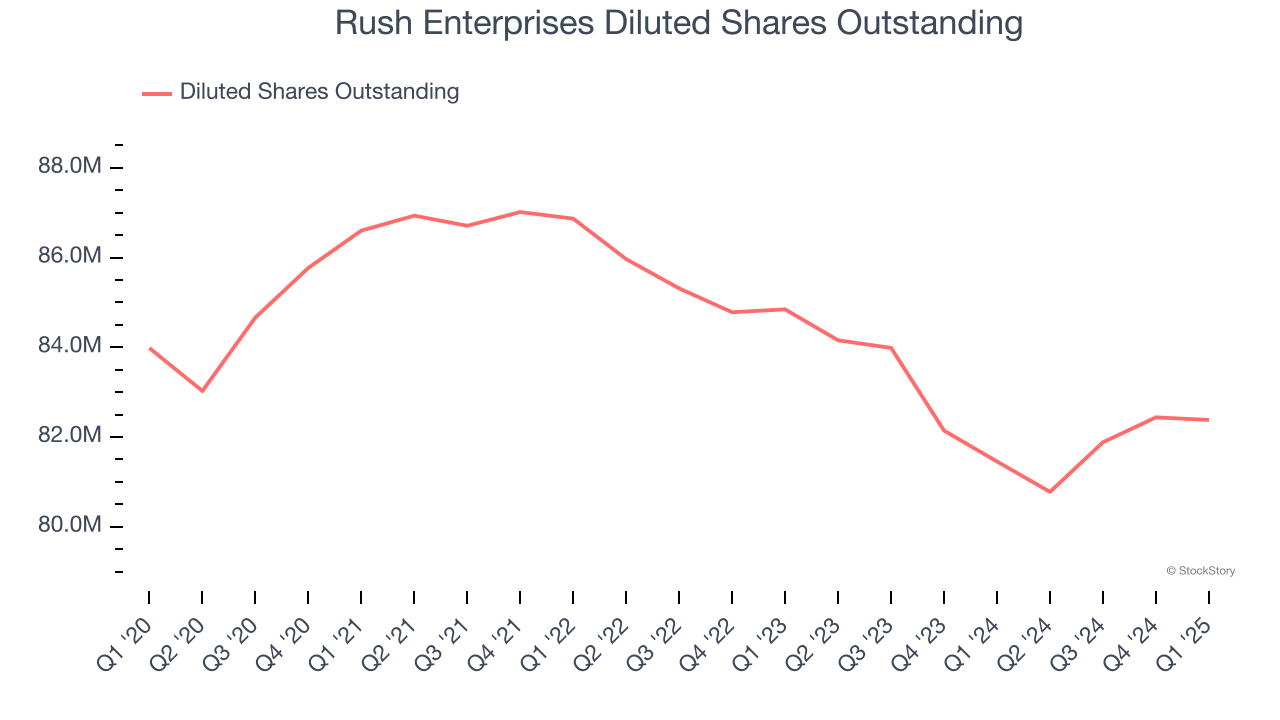
Like with revenue, we analyze EPS over a more recent period because it can provide insight into an emerging theme or development for the business.
For Rush Enterprises, its two-year annual EPS declines of 11.5% mark a reversal from its (seemingly) healthy five-year trend. We hope Rush Enterprises can return to earnings growth in the future.
In Q1, Rush Enterprises reported EPS at $0.73, down from $0.88 in the same quarter last year. Despite falling year on year, this print beat analysts’ estimates by 1.4%. We also like to analyze expected EPS growth based on Wall Street analysts’ consensus projections, but there is insufficient data.
Key Takeaways from Rush Enterprises’s Q1 Results
It was good to see Rush Enterprises narrowly top analysts’ revenue and EPS expectations this quarter. Overall, this was a decent quarter. The stock remained flat at $50.99 immediately following the results.
Rush Enterprises’s earnings report left more to be desired. Let’s look forward to see if this quarter has created an opportunity to buy the stock. If you’re making that decision, you should consider the bigger picture of valuation, business qualities, as well as the latest earnings. We cover that in our actionable full research report which you can read here, it’s free.