Lancaster Colony currently trades at $174.80 per share and has shown little upside over the past six months, posting a small loss of 1.2%. However, the stock is beating the S&P 500’s 6.9% decline during that period.
Is now the time to buy Lancaster Colony, or should you be careful about including it in your portfolio? Get the full breakdown from our expert analysts, it’s free.
Even with the strong relative performance, we're cautious about Lancaster Colony. Here are three reasons why you should be careful with LANC and a stock we'd rather own.
Why Is Lancaster Colony Not Exciting?
Known for its frozen garlic bread and Parkerhouse rolls, Lancaster Colony (NASDAQ: LANC) sells bread, dressing, and dips to the retail and food service channels.
1. Long-Term Revenue Growth Disappoints
A company’s long-term performance is an indicator of its overall quality. Any business can experience short-term success, but top-performing ones enjoy sustained growth for years. Unfortunately, Lancaster Colony’s 6.7% annualized revenue growth over the last three years was mediocre. This fell short of our benchmark for the consumer staples sector. 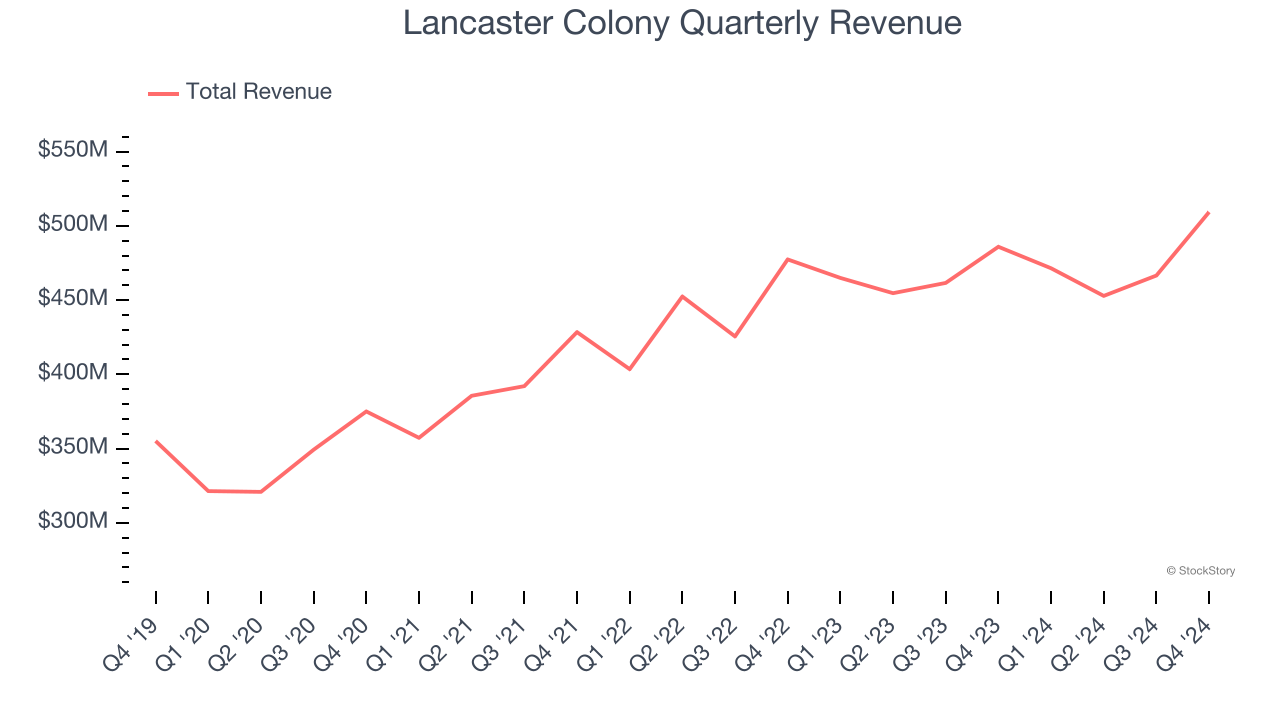
2. Fewer Distribution Channels Limit its Ceiling
With $1.9 billion in revenue over the past 12 months, Lancaster Colony is a small consumer staples company, which sometimes brings disadvantages compared to larger competitors benefiting from economies of scale and negotiating leverage with retailers.
3. Low Gross Margin Reveals Weak Structural Profitability
All else equal, we prefer higher gross margins because they usually indicate that a company sells more differentiated products, has a stronger brand, and commands pricing power.
Lancaster Colony has bad unit economics for a consumer staples company, giving it less room to reinvest and develop new products. As you can see below, it averaged a 23% gross margin over the last two years. Said differently, for every $100 in revenue, a chunky $77.01 went towards paying for raw materials, production of goods, transportation, and distribution. 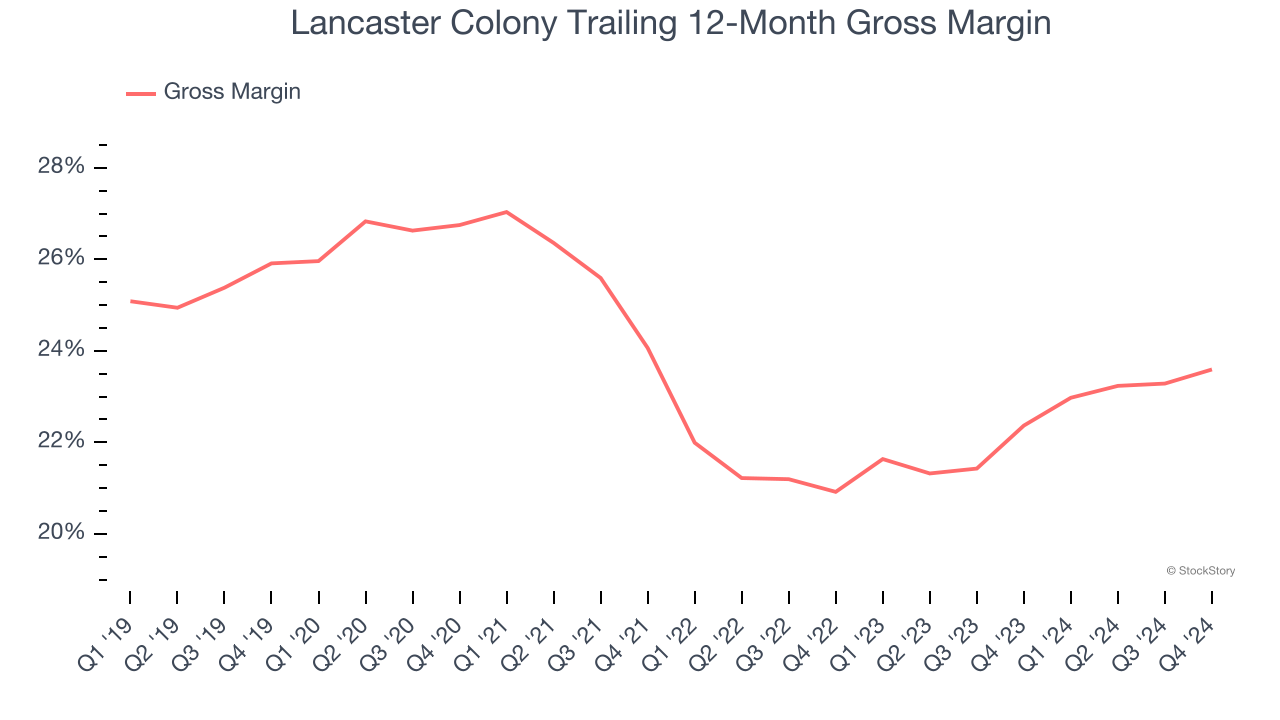
Final Judgment
Lancaster Colony’s business quality ultimately falls short of our standards. Following its recent outperformance in a weaker market environment, the stock trades at 25.4× forward price-to-earnings (or $174.80 per share). This multiple tells us a lot of good news is priced in - we think there are better opportunities elsewhere. Let us point you toward the most entrenched endpoint security platform on the market.
Stocks We Like More Than Lancaster Colony
Market indices reached historic highs following Donald Trump’s presidential victory in November 2024, but the outlook for 2025 is clouded by new trade policies that could impact business confidence and growth.
While this has caused many investors to adopt a "fearful" wait-and-see approach, we’re leaning into our best ideas that can grow regardless of the political or macroeconomic climate. Take advantage of Mr. Market by checking out our Top 9 Market-Beating Stocks. This is a curated list of our High Quality stocks that have generated a market-beating return of 175% over the last five years.
Stocks that made our list in 2019 include now familiar names such as Nvidia (+2,183% between December 2019 and December 2024) as well as under-the-radar businesses like Comfort Systems (+751% five-year return). Find your next big winner with StockStory today for free.