As the Q4 earnings season wraps, let’s dig into this quarter’s best and worst performers in the general industrial machinery industry, including John Bean (NYSE: JBTM) and its peers.
Automation that increases efficiency and connected equipment that collects analyzable data have been trending, creating new demand for general industrial machinery companies. Those who innovate and create digitized solutions can spur sales and speed up replacement cycles, but all general industrial machinery companies are still at the whim of economic cycles. Consumer spending and interest rates, for example, can greatly impact the industrial production that drives demand for these companies’ offerings.
The 15 general industrial machinery stocks we track reported a slower Q4. As a group, revenues beat analysts’ consensus estimates by 2.2% while next quarter’s revenue guidance was 2.5% below.
Amidst this news, share prices of the companies have had a rough stretch. On average, they are down 25.6% since the latest earnings results.
John Bean (NYSE: JBTM)
Tracing back to its invention of the mechanical milk bottle filler in 1884, John Bean (NYSE: JBTM) designs, manufactures, and sells equipment used for food processing and aviation.
John Bean reported revenues of $467.6 million, up 5.2% year on year. This print fell short of analysts’ expectations by 4.4%. Overall, it was a disappointing quarter for the company with a significant miss of analysts’ adjusted operating income and EPS estimates.
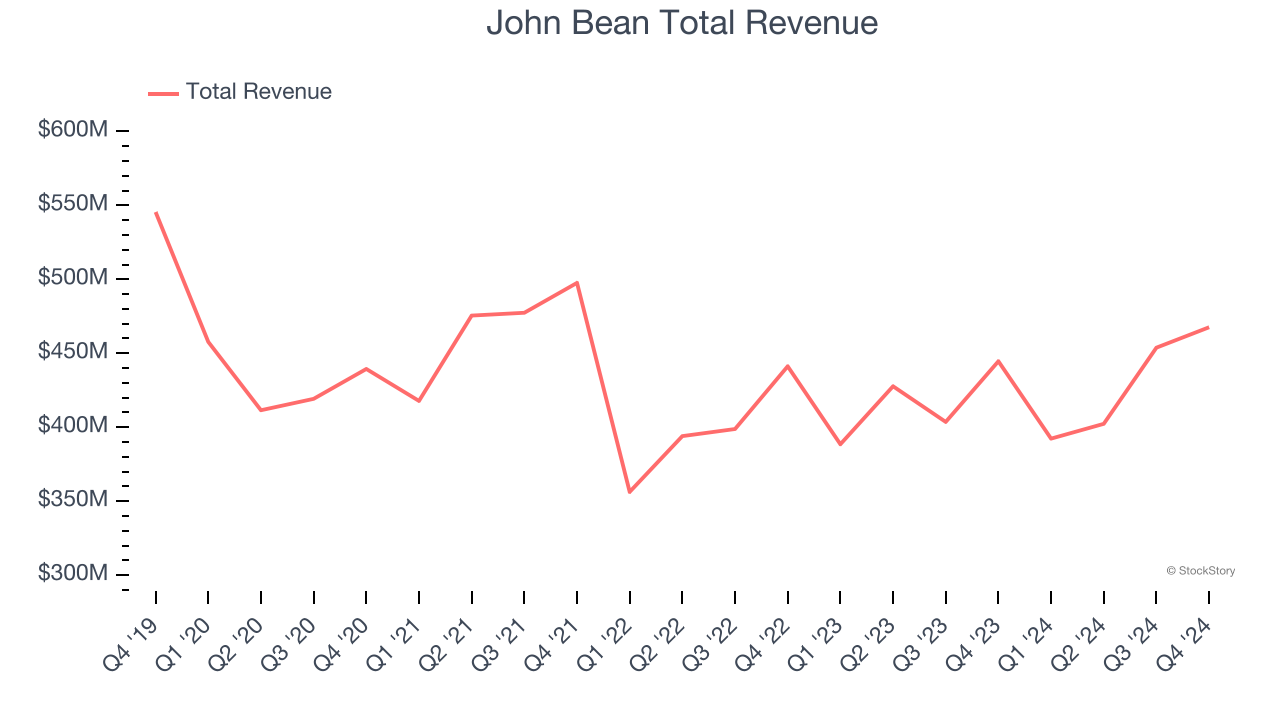
The stock is down 17.1% since reporting and currently trades at $97.06.
Read our full report on John Bean here, it’s free.
Best Q4: GE Aerospace (NYSE: GE)
One of the original 12 companies on the Dow Jones Industrial Average, General Electric (NYSE: GE) is a multinational conglomerate providing technologies for various sectors including aviation, power, renewable energy, and healthcare.
GE Aerospace reported revenues of $10.81 billion, up 14.3% year on year, outperforming analysts’ expectations by 13.7%. The business had a stunning quarter with an impressive beat of analysts’ EPS estimates and a solid beat of analysts’ EBITDA estimates.
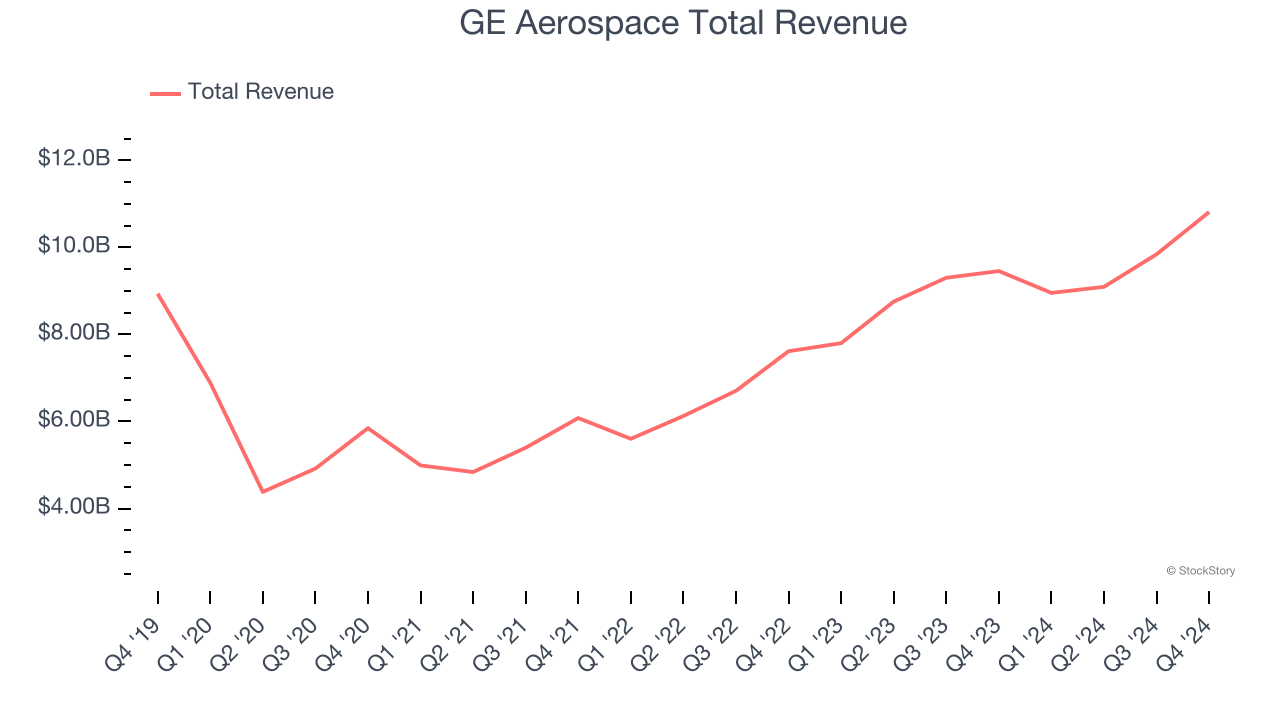
GE Aerospace scored the fastest revenue growth among its peers. Although it had a fine quarter compared to its peers, the market seems unhappy with the results as the stock is down 15.2% since reporting. It currently trades at $159.75.
Is now the time to buy GE Aerospace? Access our full analysis of the earnings results here, it’s free.
Weakest Q4: Albany (NYSE: AIN)
Founded in 1895, Albany (NYSE: AIN) is a global textiles and materials processing company, specializing in machine clothing for paper mills and engineered composite structures for aerospace and other industries.
Albany reported revenues of $286.9 million, down 11.3% year on year, falling short of analysts’ expectations by 4.2%. It was a disappointing quarter as it posted full-year revenue guidance missing analysts’ expectations.
Albany delivered the slowest revenue growth in the group. As expected, the stock is down 25.5% since the results and currently trades at $58.75.
Read our full analysis of Albany’s results here.
Columbus McKinnon (NASDAQ: CMCO)
With 19 different brands across the globe, Columbus McKinnon (NASDAQ: CMCO) offers material handling equipment for the construction, manufacturing, and transportation industries.
Columbus McKinnon reported revenues of $234.1 million, down 7.9% year on year. This print missed analysts’ expectations by 7%. It was a disappointing quarter as it also logged a significant miss of analysts’ EBITDA and EPS estimates.
Columbus McKinnon had the weakest performance against analyst estimates among its peers. The stock is down 71.2% since reporting and currently trades at $10.21.
Read our full, actionable report on Columbus McKinnon here, it’s free.
Crane (NYSE: CR)
Based in Connecticut, Crane (NYSE: CR) is a diversified manufacturer of engineered industrial products, including fluid handling, and aerospace technologies.
Crane reported revenues of $544.1 million, up 12.3% year on year. This number topped analysts’ expectations by 1.2%. Aside from that, it was a satisfactory quarter as it also recorded a solid beat of analysts’ organic revenue estimates but full-year EPS guidance missing analysts’ expectations.
The stock is down 16.9% since reporting and currently trades at $130.17.
Read our full, actionable report on Crane here, it’s free.
Want to invest in winners with rock-solid fundamentals? Check out our Top 5 Quality Compounder Stocks and add them to your watchlist. These companies are poised for growth regardless of the political or macroeconomic climate.
Join Paid Stock Investor Research
Help us make StockStory more helpful to investors like yourself. Join our paid user research session and receive a $50 Amazon gift card for your opinions. Sign up here.