
Impinj has gotten torched over the last six months - since October 2024, its stock price has dropped 67.5% to $72.61 per share. This was partly driven by its softer quarterly results and may have investors wondering how to approach the situation.
Following the drawdown, is now an opportune time to buy PI? Find out in our full research report, it’s free.
Why Does Impinj Spark Debate?
Founded by Caltech professor Carver Mead and one of his students Chris Diorio, Impinj (NASDAQ: PI) is a maker of radio-frequency identification (RFID) hardware and software.
Two Positive Attributes:
1. Skyrocketing Revenue Shows Strong Momentum
A company’s long-term sales performance can indicate its overall quality. Any business can put up a good quarter or two, but the best consistently grow over the long haul. Over the last five years, Impinj grew its sales at an exceptional 19.1% compounded annual growth rate. Its growth surpassed the average semiconductor company and shows its offerings resonate with customers. Semiconductors are a cyclical industry, and long-term investors should be prepared for periods of high growth followed by periods of revenue contractions.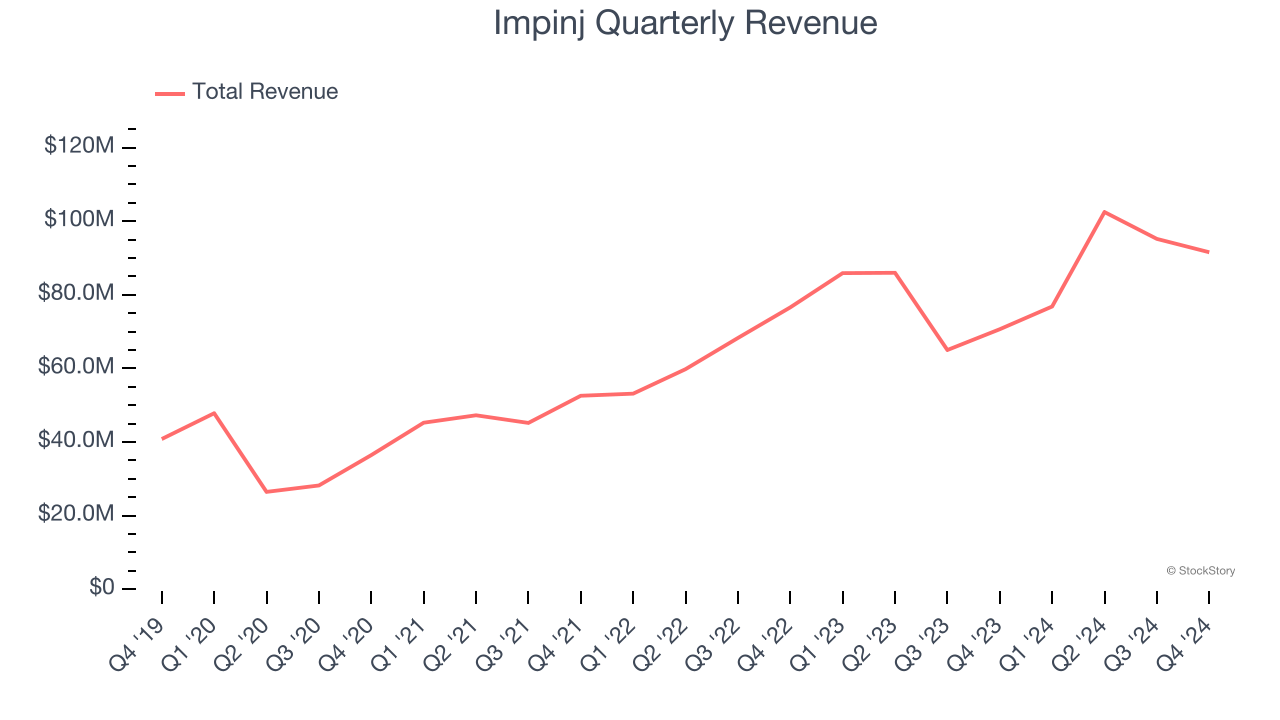
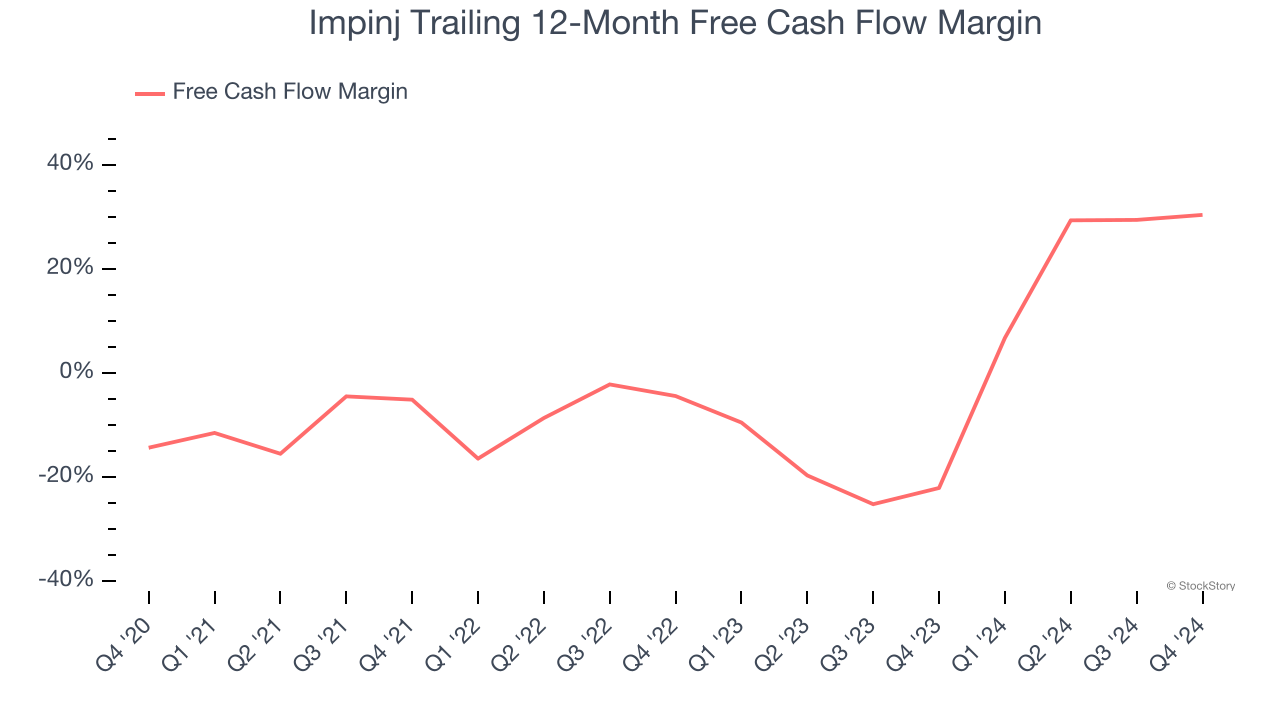
2. Increasing Free Cash Flow Margin Juices Financials
Free cash flow isn't a prominently featured metric in company financials and earnings releases, but we think it's telling because it accounts for all operating and capital expenses, making it tough to manipulate. Cash is king.
As you can see below, Impinj’s margin expanded by 44.7 percentage points over the last five years. The company’s improvement shows it’s heading in the right direction, and we can see it became a less capital-intensive business because its free cash flow profitability rose more than its operating profitability. Impinj’s free cash flow margin for the trailing 12 months was 30.4%.
One Reason to be Careful:
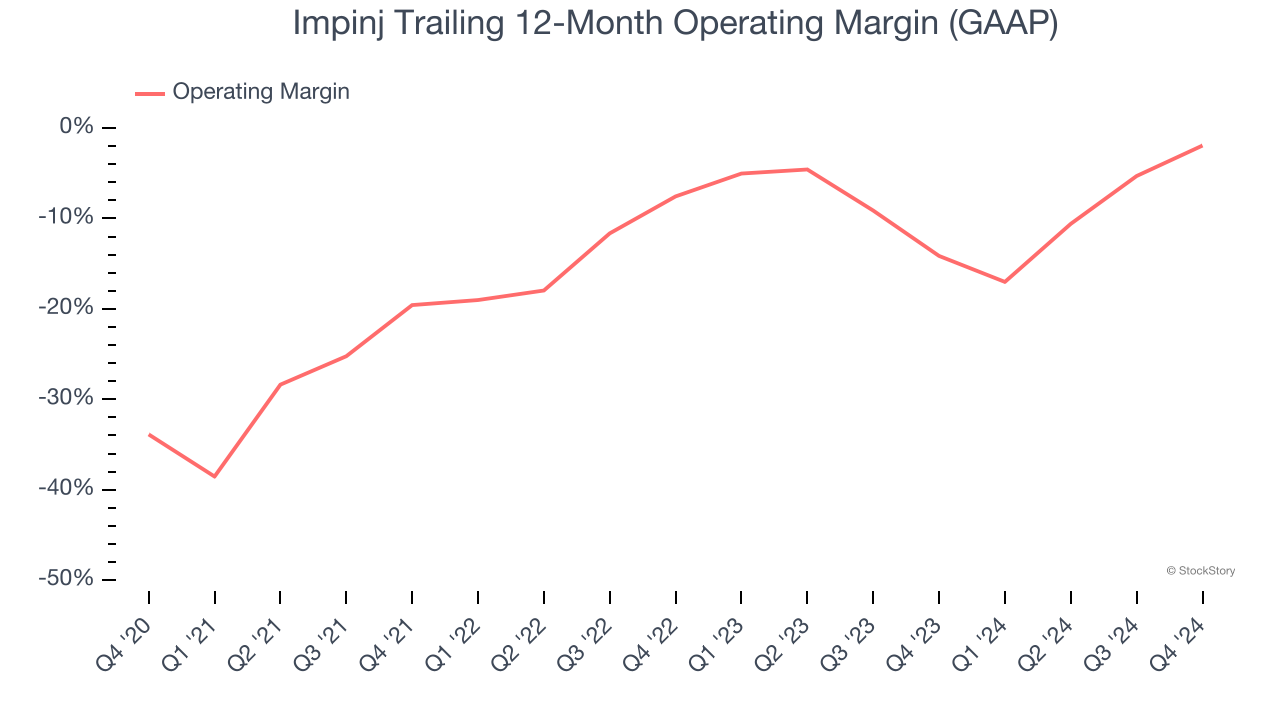
Operating Losses Sound the Alarms
Operating margin is a key measure of profitability. Think of it as net income - the bottom line - excluding the impact of taxes and interest on debt, which are less connected to business fundamentals.
Impinj’s high expenses have contributed to an average operating margin of negative 7.5% over the last two years. Unprofitable semiconductor companies require extra attention because they could get caught swimming naked when the tide goes out.
Final Judgment
Impinj has huge potential even though it has some open questions. With the recent decline, the stock trades at 24.9× forward price-to-earnings (or $72.61 per share). Is now a good time to buy? See for yourself in our comprehensive research report, it’s free.
Stocks We Like Even More Than Impinj
The market surged in 2024 and reached record highs after Donald Trump’s presidential victory in November, but questions about new economic policies are adding much uncertainty for 2025.
While the crowd speculates what might happen next, we’re homing in on the companies that can succeed regardless of the political or macroeconomic environment. Put yourself in the driver’s seat and build a durable portfolio by checking out our Top 5 Growth Stocks for this month. This is a curated list of our High Quality stocks that have generated a market-beating return of 175% over the last five years.
Stocks that made our list in 2019 include now familiar names such as Nvidia (+2,183% between December 2019 and December 2024) as well as under-the-radar businesses like Sterling Infrastructure (+1,096% five-year return). Find your next big winner with StockStory today for free.


