Shyft has gotten torched over the last six months - since October 2024, its stock price has dropped 23.1% to $8.98 per share. This was partly driven by its softer quarterly results and may have investors wondering how to approach the situation.
Is now the time to buy Shyft, or should you be careful about including it in your portfolio? Dive into our full research report to see our analyst team’s opinion, it’s free.
Even though the stock has become cheaper, we're cautious about Shyft. Here are three reasons why we avoid SHYF and a stock we'd rather own.
Why Do We Think Shyft Will Underperform?
Notably receiving an order from FedEx for electric vehicles, Shyft (NASDAQ: SHYF) offers specialty vehicles and truck bodies for various industries.
1. Long-Term Revenue Growth Flatter Than a Pancake
A company’s long-term sales performance is one signal of its overall quality. Even a bad business can shine for one or two quarters, but a top-tier one grows for years. Unfortunately, Shyft struggled to consistently increase demand as its $786.2 million of sales for the trailing 12 months was close to its revenue five years ago. This was below our standards and signals it’s a low quality business. 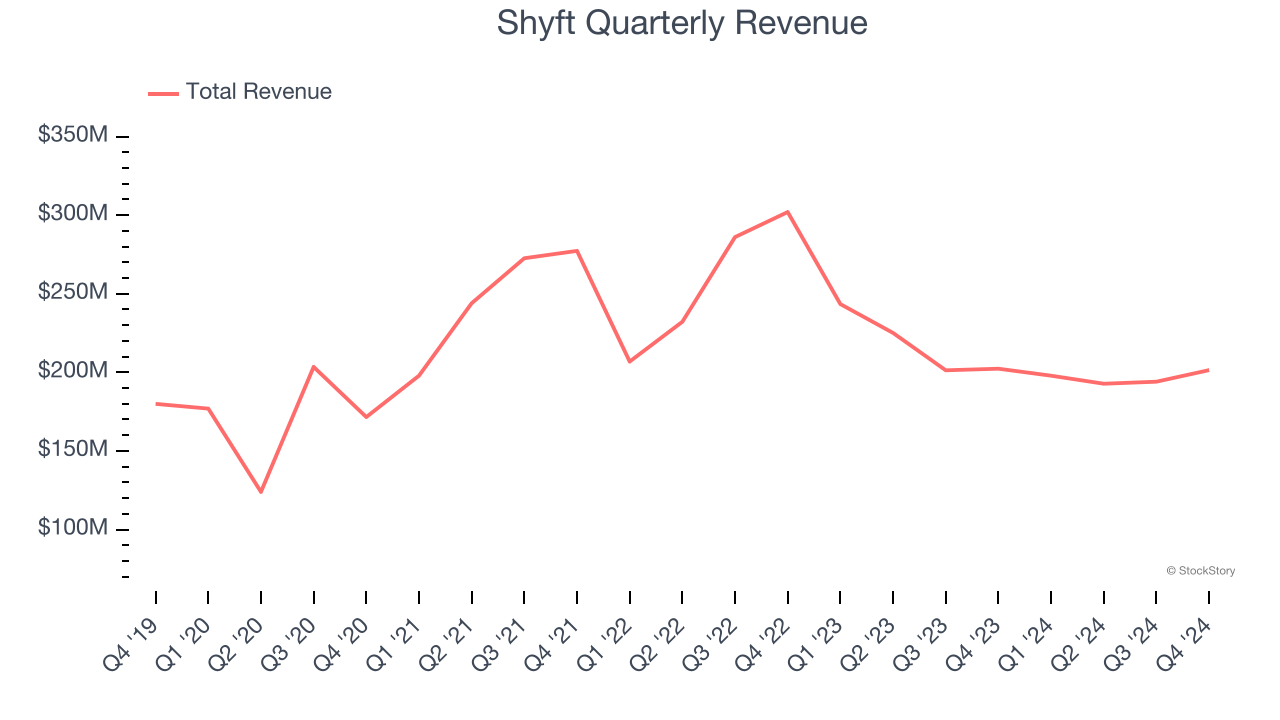
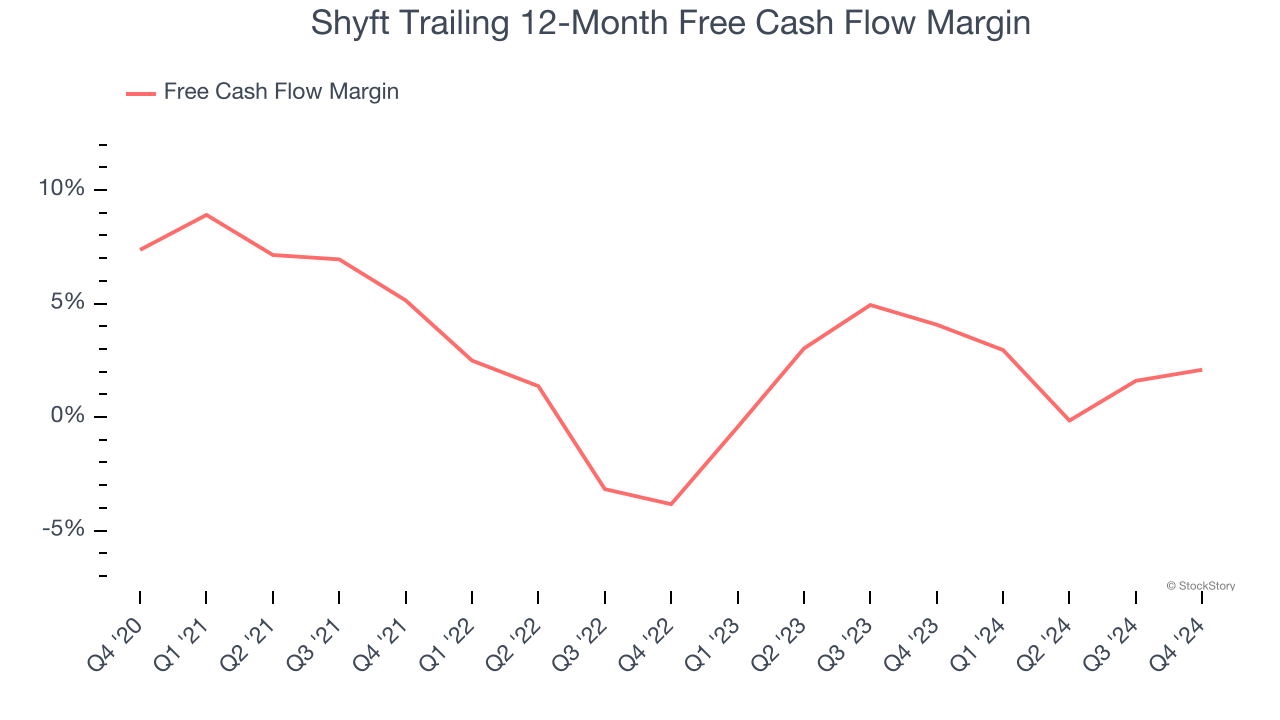
2. Free Cash Flow Margin Dropping
If you’ve followed StockStory for a while, you know we emphasize free cash flow. Why, you ask? We believe that in the end, cash is king, and you can’t use accounting profits to pay the bills.
As you can see below, Shyft’s margin dropped by 5.3 percentage points over the last five years. Almost any movement in the wrong direction is undesirable because of its already low cash conversion. If the trend continues, it could signal it’s in the middle of a big investment cycle. Shyft’s free cash flow margin for the trailing 12 months was 2.1%.
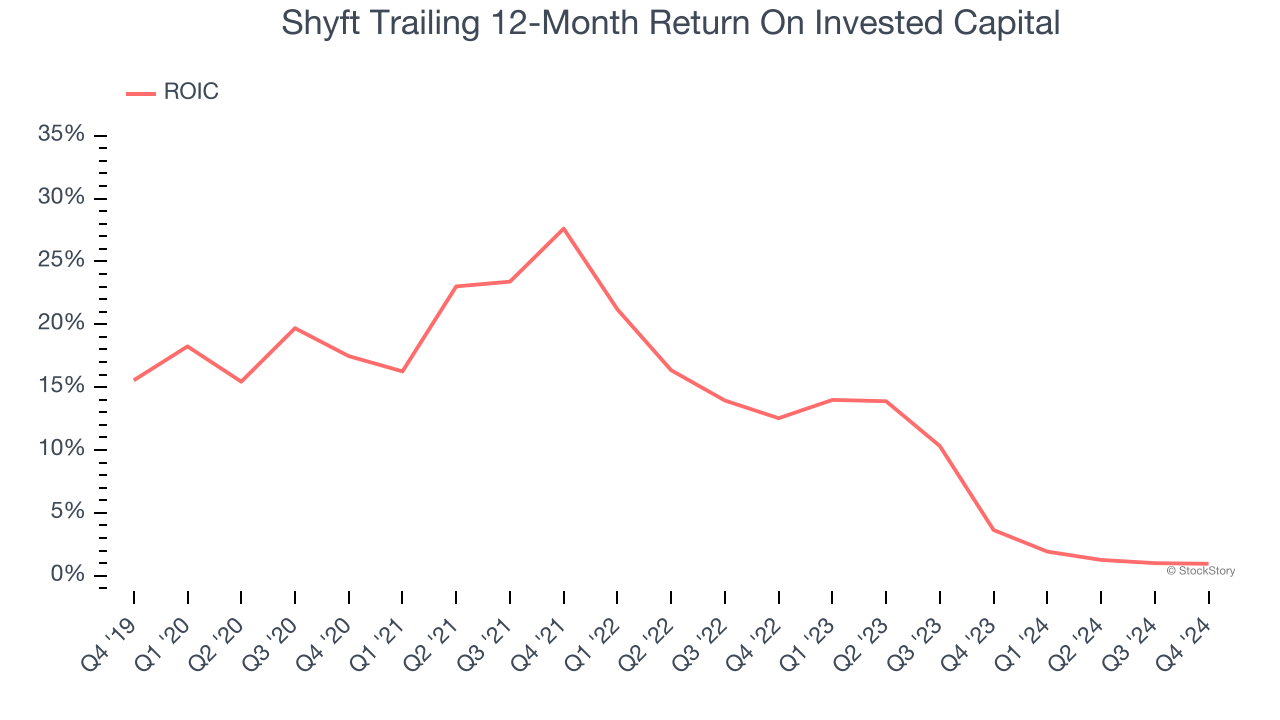
3. New Investments Fail to Bear Fruit as ROIC Declines
ROIC, or return on invested capital, is a metric showing how much operating profit a company generates relative to the money it has raised (debt and equity).
We like to invest in businesses with high returns, but the trend in a company’s ROIC is what often surprises the market and moves the stock price. Over the last few years, Shyft’s ROIC has unfortunately decreased significantly. We like what management has done in the past, but its declining returns are perhaps a symptom of fewer profitable growth opportunities.
Final Judgment
We see the value of companies helping their customers, but in the case of Shyft, we’re out. After the recent drawdown, the stock trades at 10.8× forward price-to-earnings (or $8.98 per share). While this valuation is reasonable, we don’t see a big opportunity at the moment. There are superior stocks to buy right now. We’d recommend looking at a fast-growing restaurant franchise with an A+ ranch dressing sauce.
Stocks We Would Buy Instead of Shyft
Market indices reached historic highs following Donald Trump’s presidential victory in November 2024, but the outlook for 2025 is clouded by new trade policies that could impact business confidence and growth.
While this has caused many investors to adopt a "fearful" wait-and-see approach, we’re leaning into our best ideas that can grow regardless of the political or macroeconomic climate. Take advantage of Mr. Market by checking out our Top 9 Market-Beating Stocks. This is a curated list of our High Quality stocks that have generated a market-beating return of 175% over the last five years.
Stocks that made our list in 2019 include now familiar names such as Nvidia (+2,183% between December 2019 and December 2024) as well as under-the-radar businesses like Sterling Infrastructure (+1,096% five-year return). Find your next big winner with StockStory today for free.