Shareholders of Flex would probably like to forget the past six months even happened. The stock has dropped 23% and now trades at a new 52-week low of $26.21. This might have investors contemplating their next move.
Is now the time to buy Flex, or should you be careful about including it in your portfolio? Get the full stock story straight from our expert analysts, it’s free.
Despite the more favorable entry price, we're sitting this one out for now. Here are three reasons why we avoid FLEX and a stock we'd rather own.
Why Is Flex Not Exciting?
Originally known as Flextronics until its 2016 rebranding, Flex (NASDAQ: FLEX) is a global manufacturing partner that designs, engineers, and builds products for companies across industries from medical devices to solar trackers.
1. Long-Term Revenue Growth Flatter Than a Pancake
A company’s long-term sales performance can indicate its overall quality. Any business can have short-term success, but a top-tier one grows for years. Unfortunately, Flex struggled to consistently increase demand as its $25.58 billion of sales for the trailing 12 months was close to its revenue five years ago. This was below our standards and signals it’s a lower quality business. 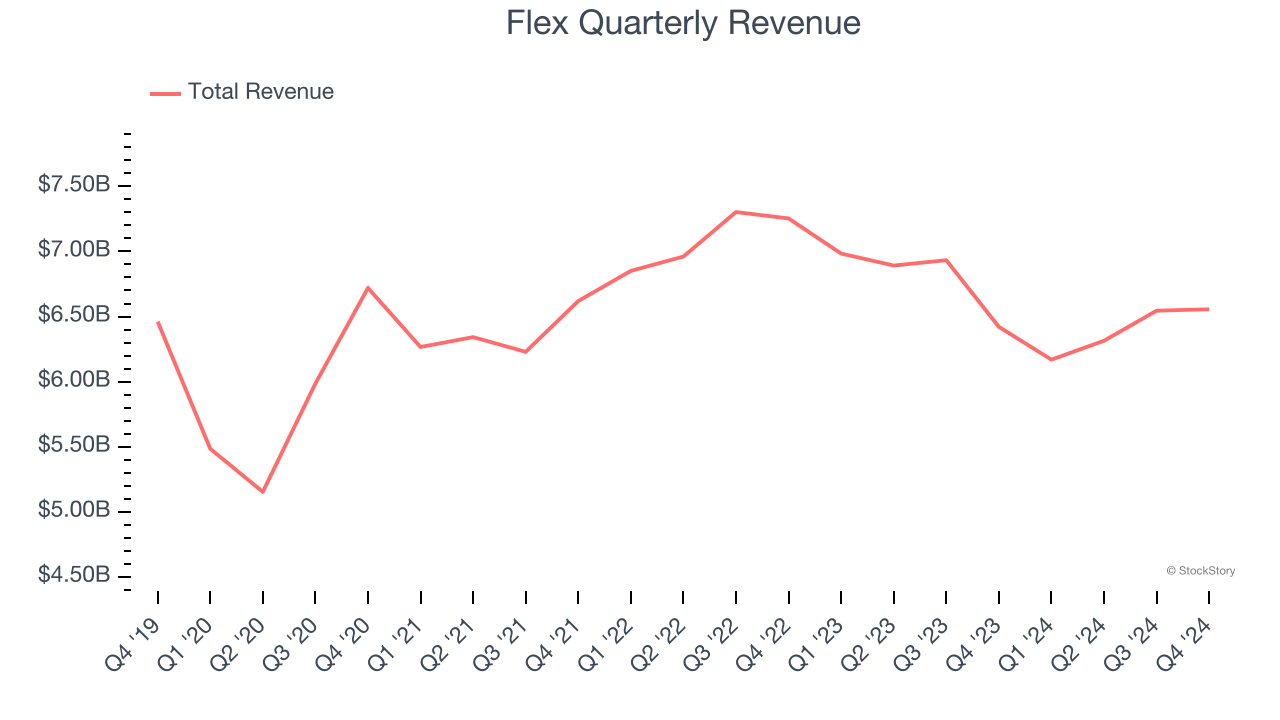
2. Projected Revenue Growth Is Slim
Forecasted revenues by Wall Street analysts signal a company’s potential. Predictions may not always be accurate, but accelerating growth typically boosts valuation multiples and stock prices while slowing growth does the opposite.
Over the next 12 months, sell-side analysts expect Flex’s revenue to rise by 1.8%. While this projection implies its newer products and services will fuel better top-line performance, it is still below average for the sector.
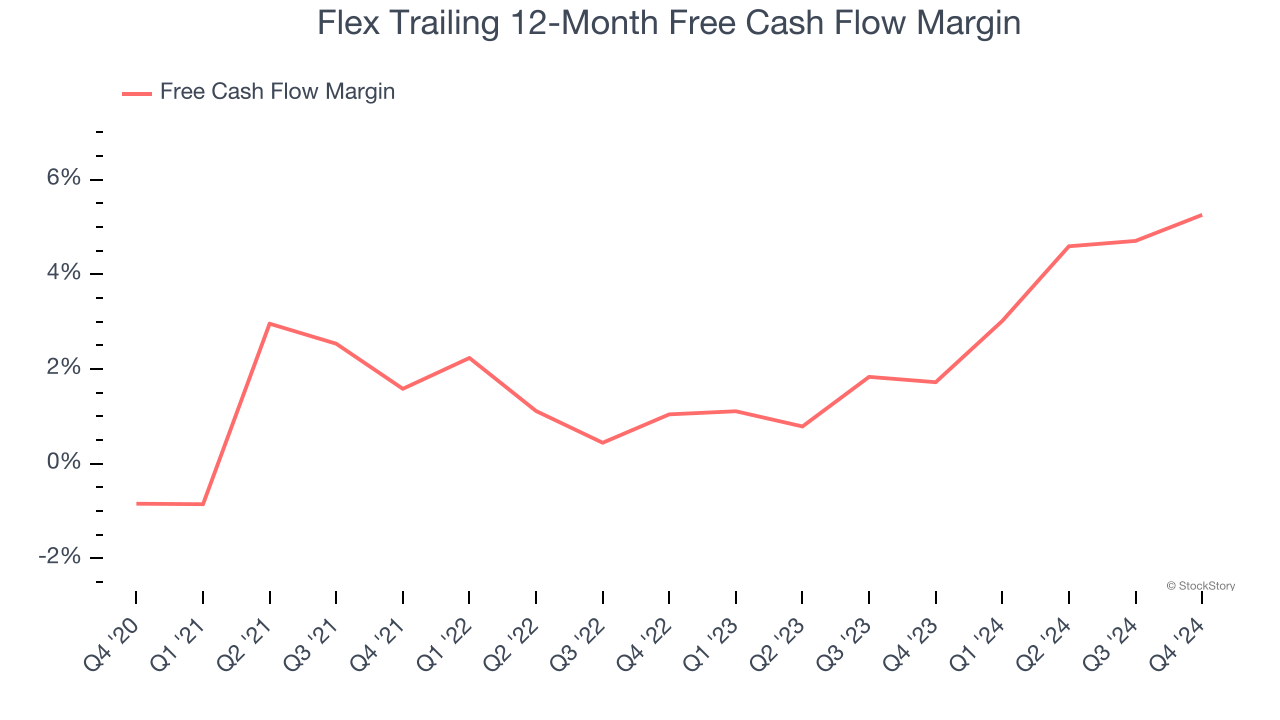
3. Mediocre Free Cash Flow Margin Limits Reinvestment Potential
Free cash flow isn't a prominently featured metric in company financials and earnings releases, but we think it's telling because it accounts for all operating and capital expenses, making it tough to manipulate. Cash is king.
Flex has shown poor cash profitability over the last five years, giving the company limited opportunities to return capital to shareholders. Its free cash flow margin averaged 1.8%, lousy for a business services business.
Final Judgment
Flex isn’t a terrible business, but it doesn’t pass our bar. Following the recent decline, the stock trades at 10.1× forward price-to-earnings (or $26.21 per share). Investors with a higher risk tolerance might like the company, but we don’t really see a big opportunity at the moment. We're fairly confident there are better stocks to buy right now. We’d recommend looking at one of our top software and edge computing picks.
Stocks We Would Buy Instead of Flex
The market surged in 2024 and reached record highs after Donald Trump’s presidential victory in November, but questions about new economic policies are adding much uncertainty for 2025.
While the crowd speculates what might happen next, we’re homing in on the companies that can succeed regardless of the political or macroeconomic environment. Put yourself in the driver’s seat and build a durable portfolio by checking out our Top 5 Strong Momentum Stocks for this week. This is a curated list of our High Quality stocks that have generated a market-beating return of 175% over the last five years.
Stocks that made our list in 2019 include now familiar names such as Nvidia (+2,183% between December 2019 and December 2024) as well as under-the-radar businesses like Sterling Infrastructure (+1,096% five-year return). Find your next big winner with StockStory today for free.


