American restaurant chain BJ’s Restaurants (NASDAQ: BJRI) met Wall Street’s revenue expectations in Q1 CY2025, with sales up 3.2% year on year to $348 million. Its non-GAAP profit of $0.59 per share was 53.4% above analysts’ consensus estimates.
Is now the time to buy BJ's? Find out by accessing our full research report, it’s free.
BJ's (BJRI) Q1 CY2025 Highlights:
- Revenue: $348 million vs analyst estimates of $348 million (3.2% year-on-year growth, in line)
- Adjusted EPS: $0.59 vs analyst estimates of $0.38 (53.4% beat)
- Adjusted EBITDA: $35.35 million vs analyst estimates of $32.1 million (10.2% margin, 10.1% beat)
- EBITDA guidance for the full year is $135.5 million at the midpoint, above analyst estimates of $130.5 million
- Operating Margin: 4.3%, up from 2.4% in the same quarter last year
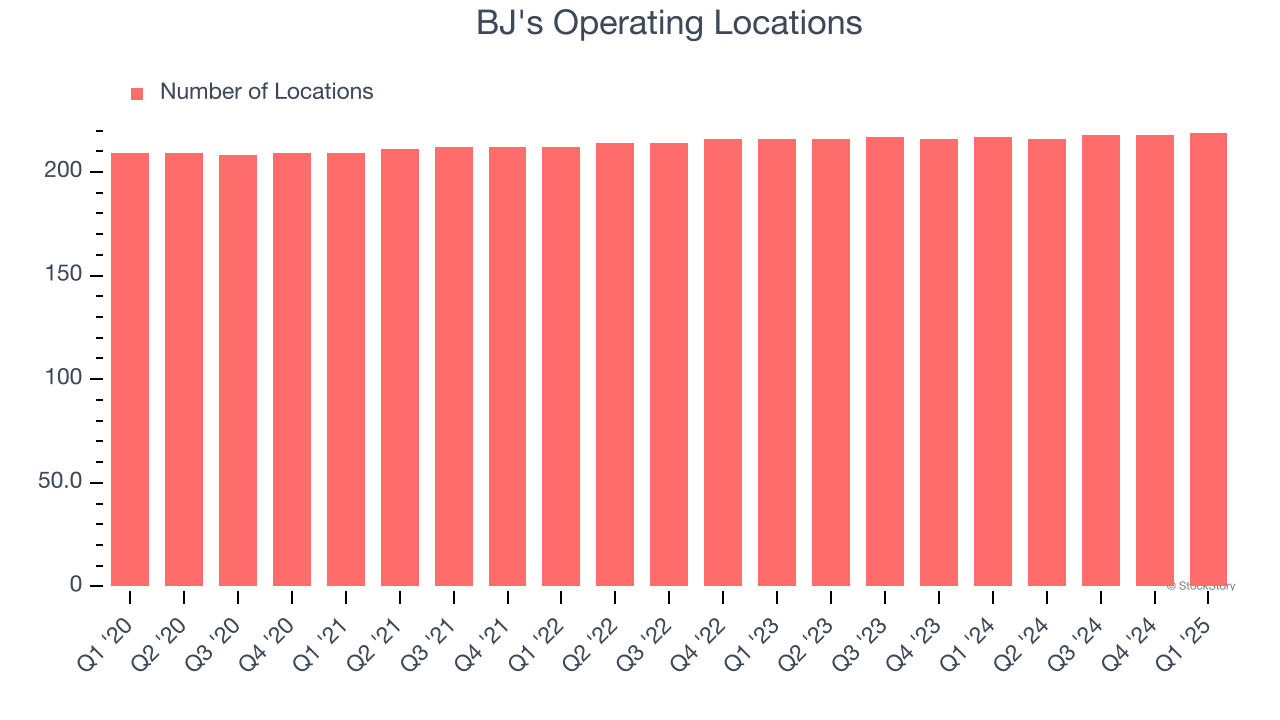
- Locations: 219 at quarter end, up from 217 in the same quarter last year
- Same-Store Sales rose 1.7% year on year (-1.7% in the same quarter last year)
- Market Capitalization: $742.9 million
“We are growing increasingly confident in our strategic growth plans and the effectiveness of our near-term initiatives that are focused on driving sales and profitability,” commented Brad Richmond, Interim Chief Executive Officer.
Company Overview
Founded in 1978 in California, BJ’s Restaurants (NASDAQ: BJRI) is a chain of restaurants whose menu features classic American dishes, often with a twist.
Sales Growth
A company’s long-term performance is an indicator of its overall quality. Any business can have short-term success, but a top-tier one grows for years.
With $1.37 billion in revenue over the past 12 months, BJ's is a mid-sized restaurant chain, which sometimes brings disadvantages compared to larger competitors benefiting from better brand awareness and economies of scale.
As you can see below, BJ’s 3.3% annualized revenue growth over the last six years (we compare to 2019 to normalize for COVID-19 impacts) was sluggish as its restaurant footprint remained unchanged and it barely increased sales at existing, established dining locations.
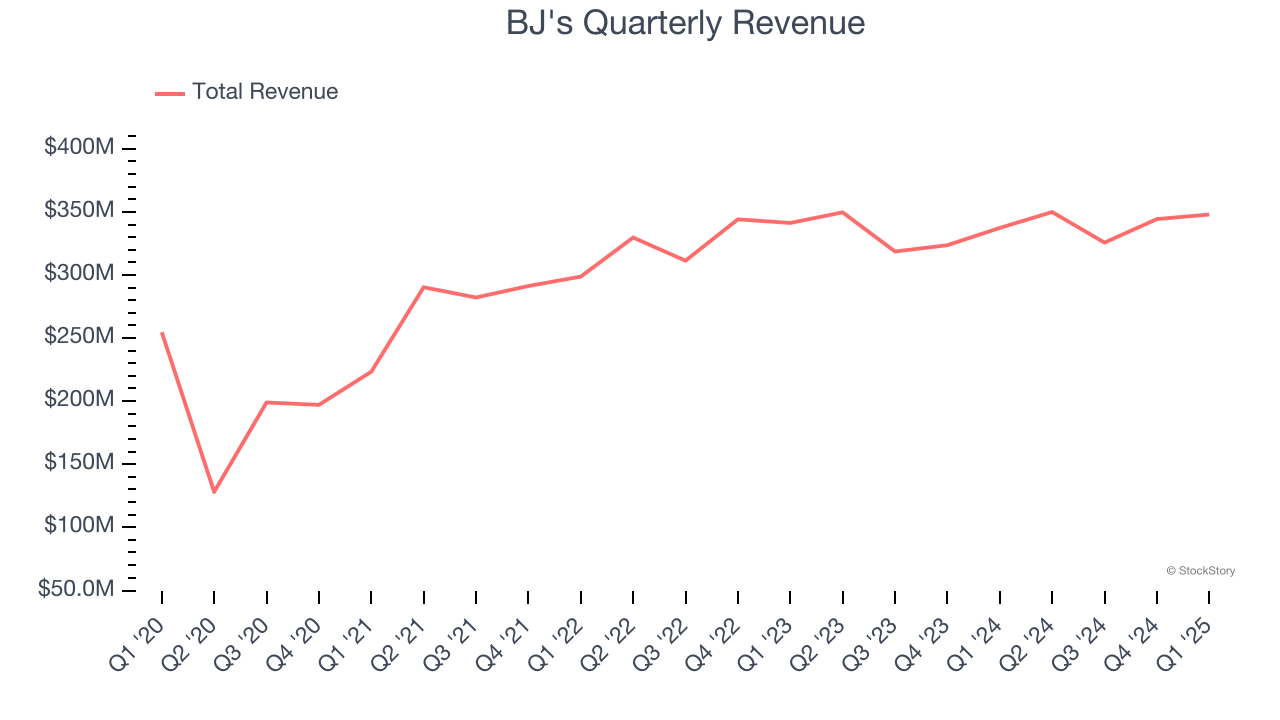
This quarter, BJ's grew its revenue by 3.2% year on year, and its $348 million of revenue was in line with Wall Street’s estimates.
Looking ahead, sell-side analysts expect revenue to grow 3.3% over the next 12 months, similar to its six-year rate. This projection is underwhelming and suggests its newer menu offerings will not accelerate its top-line performance yet.
Today’s young investors won’t have read the timeless lessons in Gorilla Game: Picking Winners In High Technology because it was written more than 20 years ago when Microsoft and Apple were first establishing their supremacy. But if we apply the same principles, then enterprise software stocks leveraging their own generative AI capabilities may well be the Gorillas of the future. So, in that spirit, we are excited to present our Special Free Report on a profitable, fast-growing enterprise software stock that is already riding the automation wave and looking to catch the generative AI next.
Restaurant Performance
Number of Restaurants
The number of dining locations a restaurant chain operates is a critical driver of how quickly company-level sales can grow.
BJ's listed 219 locations in the latest quarter and has kept its restaurant count flat over the last two years while other restaurant businesses have opted for growth.
When a chain doesn’t open many new restaurants, it usually means there’s stable demand for its meals and it’s focused on improving operational efficiency to increase profitability.
Same-Store Sales
A company's restaurant base only paints one part of the picture. When demand is high, it makes sense to open more. But when demand is low, it’s prudent to close some locations and use the money in other ways. Same-store sales is an industry measure of whether revenue is growing at those existing restaurants and is driven by customer visits (often called traffic) and the average spending per customer (ticket).
BJ’s demand within its existing dining locations has been relatively stable over the last two years but was below most restaurant chains. On average, the company’s same-store sales have grown by 1.5% per year. Given its flat restaurant base over the same period, this performance stems from a mixture of higher prices and increased foot traffic at existing locations.
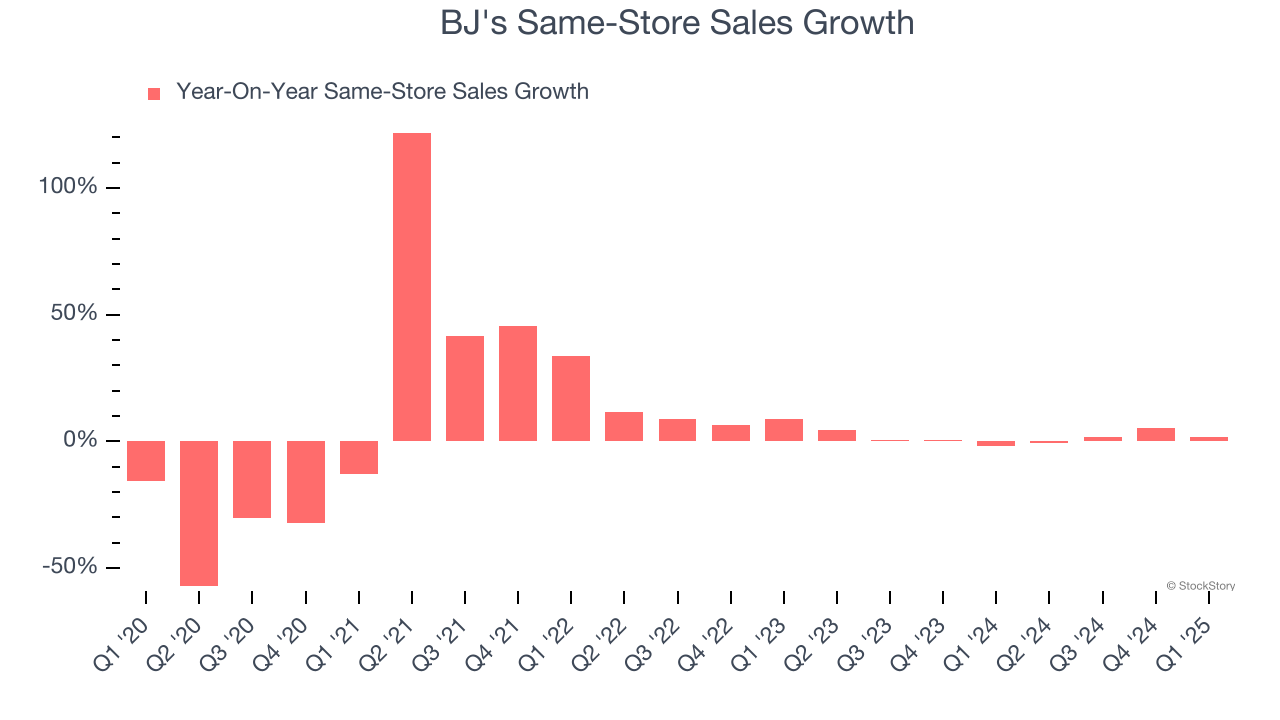
In the latest quarter, BJ’s same-store sales rose 1.7% year on year. This performance was more or less in line with its historical levels.
Key Takeaways from BJ’s Q1 Results
We were impressed by how significantly BJ's blew past analysts’ EPS expectations this quarter. We were also excited its EBITDA outperformed Wall Street’s estimates by a wide margin. On the other hand, its same-store sales was in line. Zooming out, we think this was a solid print. The stock traded up 4.8% to $35.10 immediately following the results.
Indeed, BJ's had a rock-solid quarterly earnings result, but is this stock a good investment here? If you’re making that decision, you should consider the bigger picture of valuation, business qualities, as well as the latest earnings. We cover that in our actionable full research report which you can read here, it’s free.


