
Biotechnology company Moderna (NASDAQ: MRNA) missed Wall Street’s revenue expectations in Q1 CY2025, with sales falling 35.3% year on year to $108 million. The company’s full-year revenue guidance of $2 billion at the midpoint came in 6.1% below analysts’ estimates. Its GAAP loss of $2.52 per share was 18.6% above analysts’ consensus estimates.
Is now the time to buy Moderna? Find out by accessing our full research report, it’s free.
Moderna (MRNA) Q1 CY2025 Highlights:
- Revenue: $108 million vs analyst estimates of $117.9 million (35.3% year-on-year decline, 8.4% miss)
- EPS (GAAP): -$2.52 vs analyst estimates of -$3.10 (18.6% beat)
- Adjusted EBITDA: -$896 million vs analyst estimates of -$1.07 billion (-830% margin, 16% beat)
- The company reconfirmed its revenue guidance for the full year of $2 billion at the midpoint
- Operating Margin: -972%, down from -758% in the same quarter last year
- Free Cash Flow was -$1.15 billion compared to -$1.19 billion in the same quarter last year
- Market Capitalization: $11.03 billion
Company Overview
Rising to global prominence during the COVID-19 pandemic with one of the first effective vaccines, Moderna (NASDAQ: MRNA) develops messenger RNA (mRNA) medicines that direct the body's cells to produce proteins with therapeutic or preventive benefits for various diseases.
Sales Growth
Reviewing a company’s long-term sales performance reveals insights into its quality. Any business can experience short-term success, but top-performing ones enjoy sustained growth for years. Luckily, Moderna’s sales grew at an incredible 127% compounded annual growth rate over the last five years. Its growth beat the average healthcare company and shows its offerings resonate with customers.
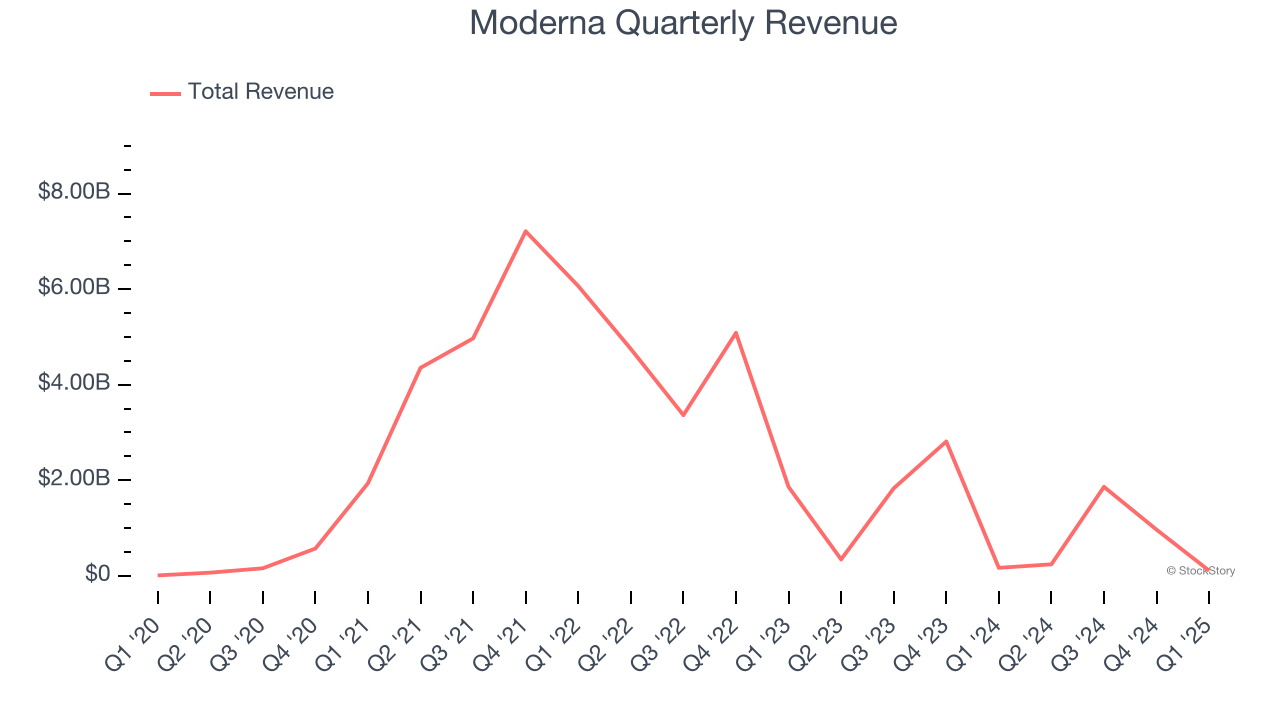
Long-term growth is the most important, but within healthcare, a half-decade historical view may miss new innovations or demand cycles. Moderna’s recent performance marks a sharp pivot from its five-year trend as its revenue has shown annualized declines of 54.1% over the last two years. 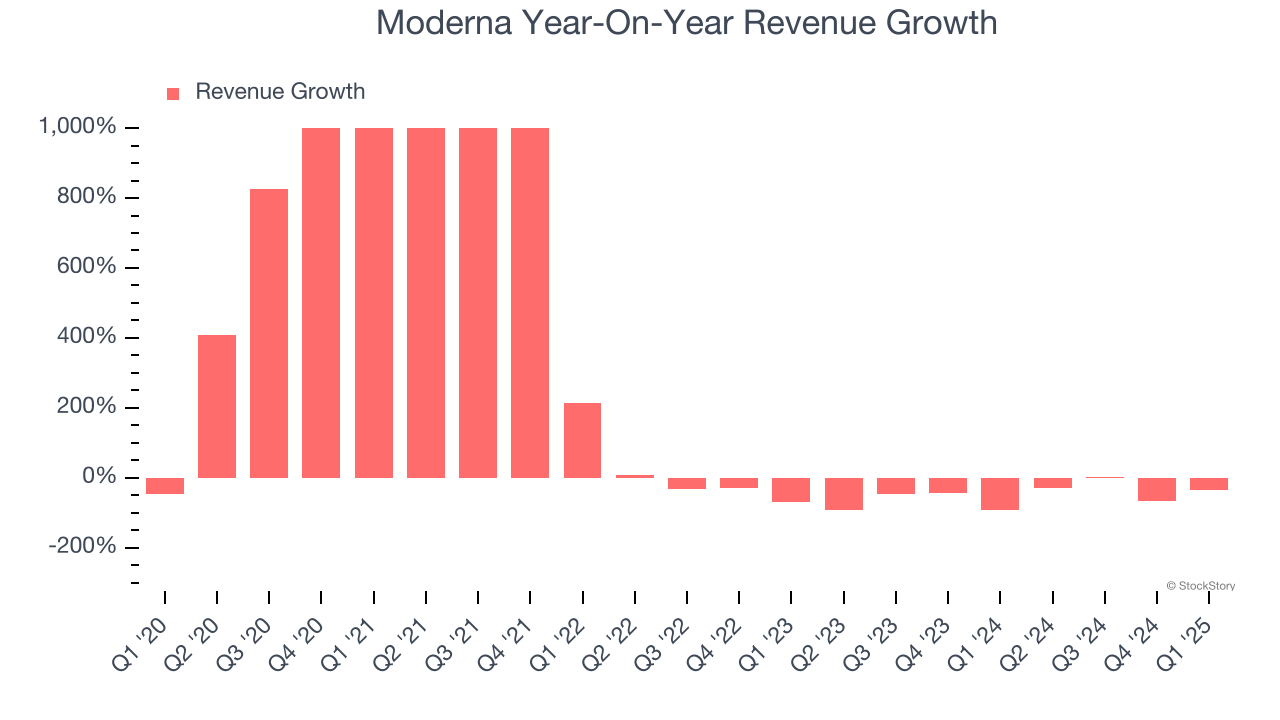
This quarter, Moderna missed Wall Street’s estimates and reported a rather uninspiring 35.3% year-on-year revenue decline, generating $108 million of revenue.
Looking ahead, sell-side analysts expect revenue to decline by 33.6% over the next 12 months. While this projection is better than its two-year trend, it's hard to get excited about a company that is struggling with demand.
Here at StockStory, we certainly understand the potential of thematic investing. Diverse winners from Microsoft (MSFT) to Alphabet (GOOG), Coca-Cola (KO) to Monster Beverage (MNST) could all have been identified as promising growth stories with a megatrend driving the growth. So, in that spirit, we’ve identified a relatively under-the-radar profitable growth stock benefiting from the rise of AI, available to you FREE via this link.
Operating Margin
Moderna has been an efficient company over the last five years. It was one of the more profitable businesses in the healthcare sector, boasting an average operating margin of 26.4%.
Looking at the trend in its profitability, Moderna’s operating margin decreased significantly over the last five years. This performance was caused by more recent speed bumps as the company’s margin fell by 149.4 percentage points on a two-year basis. We’re disappointed in these results because it shows its expenses were rising and it couldn’t pass those costs onto its customers.
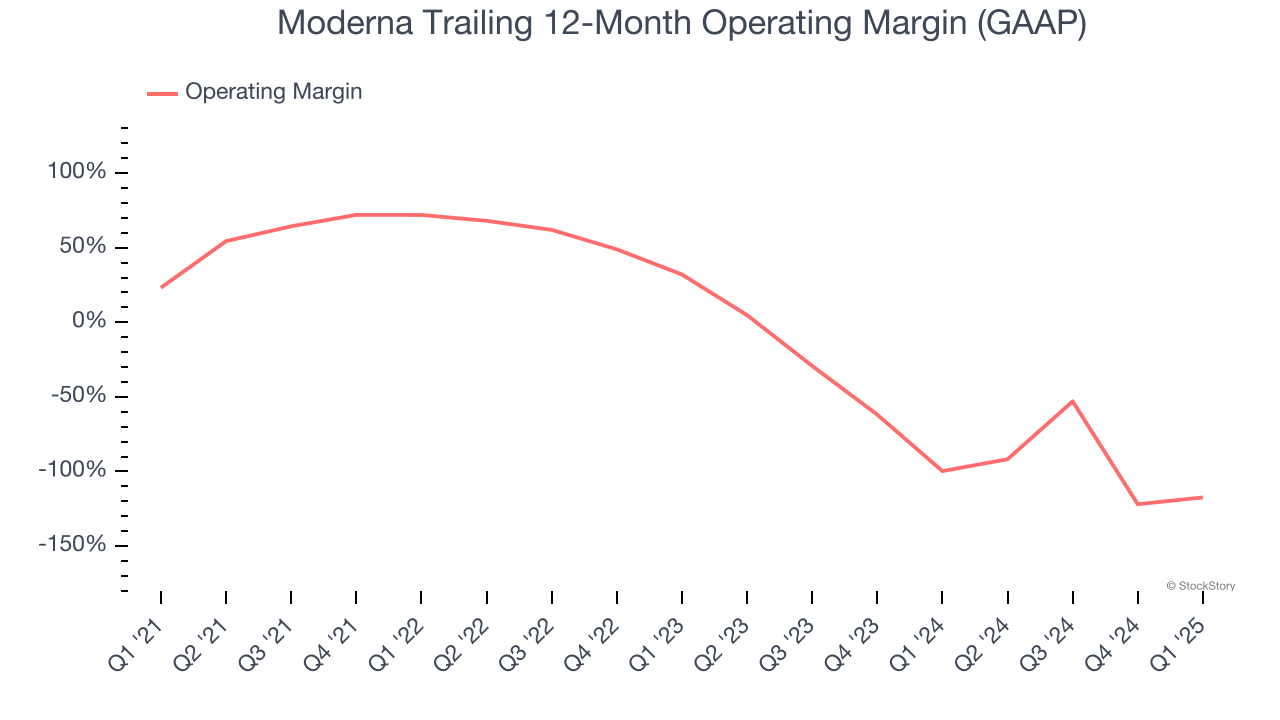
This quarter, Moderna generated an operating profit margin of negative 972%, down 214.1 percentage points year on year. This contraction shows it was less efficient because its expenses increased relative to its revenue.
Earnings Per Share
Revenue trends explain a company’s historical growth, but the long-term change in earnings per share (EPS) points to the profitability of that growth – for example, a company could inflate its sales through excessive spending on advertising and promotions.
Moderna’s earnings losses deepened over the last five years as its EPS dropped 42.2% annually. We tend to steer our readers away from companies with falling EPS, where diminishing earnings could imply changing secular trends and preferences. If the tide turns unexpectedly, Moderna’s low margin of safety could leave its stock price susceptible to large downswings.
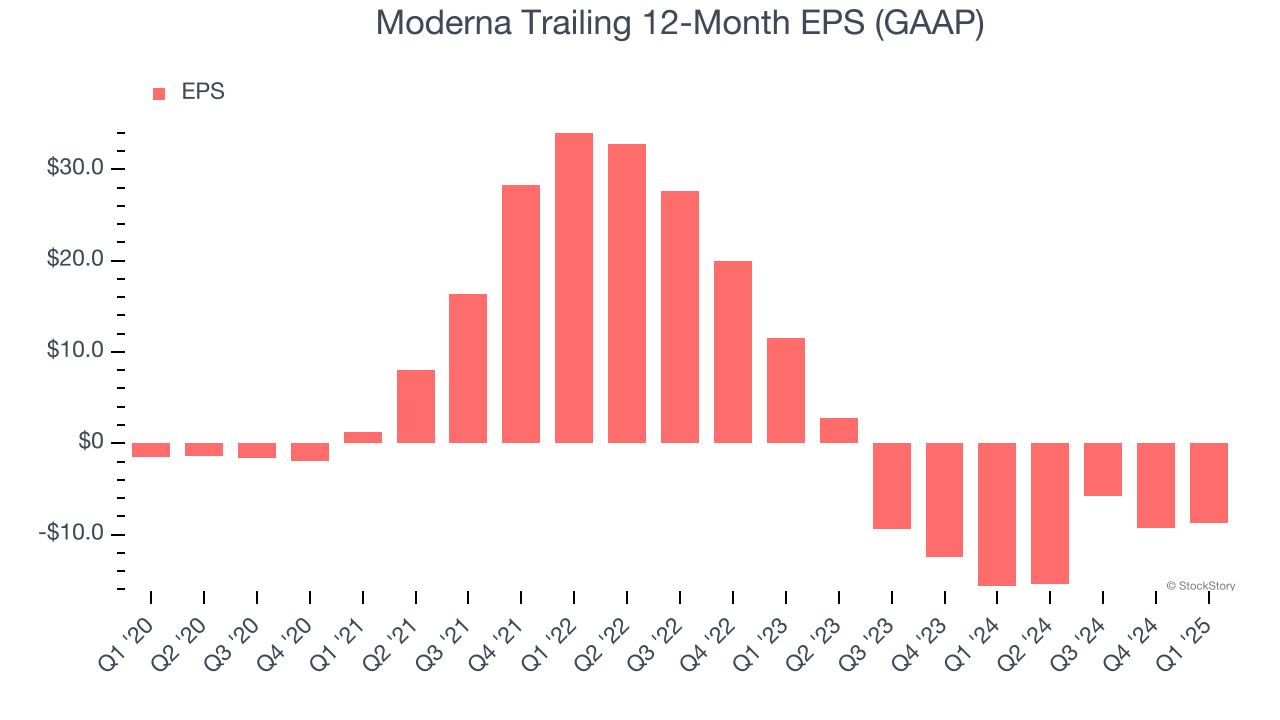
In Q1, Moderna reported EPS at negative $2.52, up from negative $3.08 in the same quarter last year. This print easily cleared analysts’ estimates, and shareholders should be content with the results. Over the next 12 months, Wall Street expects Moderna to perform poorly. Analysts forecast its full-year EPS of negative $8.73 will tumble to negative $10.31.
Key Takeaways from Moderna’s Q1 Results
We enjoyed seeing Moderna beat analysts’ EPS expectations this quarter. On the other hand, its full-year revenue guidance missed significantly and its revenue fell short of Wall Street’s estimates. Overall, this was a weaker quarter. The stock remained flat at $28.54 immediately after reporting.
Moderna’s latest earnings report disappointed. One quarter doesn’t define a company’s quality, so let’s explore whether the stock is a buy at the current price. What happened in the latest quarter matters, but not as much as longer-term business quality and valuation, when deciding whether to invest in this stock. We cover that in our actionable full research report which you can read here, it’s free.


