
Payroll and human resources software provider, Paylocity (NASDAQ: PCTY) announced better-than-expected revenue in Q1 CY2025, with sales up 13.3% year on year to $454.5 million. Guidance for next quarter’s revenue was better than expected at $388 million at the midpoint, 1.5% above analysts’ estimates. Its non-GAAP profit of $2.43 per share was 14.8% above analysts’ consensus estimates.
Is now the time to buy Paylocity? Find out by accessing our full research report, it’s free.
Paylocity (PCTY) Q1 CY2025 Highlights:
- Revenue: $454.5 million vs analyst estimates of $441.9 million (13.3% year-on-year growth, 2.9% beat)
- Adjusted EPS: $2.43 vs analyst estimates of $2.12 (14.8% beat)
- Adjusted Operating Income: $172.7 million vs analyst estimates of $148.7 million (38% margin, 16.2% beat)
- Revenue Guidance for Q2 CY2025 is $388 million at the midpoint, above analyst estimates of $382.1 million
- EBITDA guidance for the full year is $573 million at the midpoint, above analyst estimates of $547.2 million
- Operating Margin: 27.9%, up from 26.5% in the same quarter last year
- Free Cash Flow Margin: 54.7%, up from 9.8% in the previous quarter
- Market Capitalization: $10.74 billion
“Our solid results continued into the third quarter of fiscal 25, with recurring revenue growth of 15%, total revenue growth of 13% and increased revenue and profitability guidance for the fiscal year. We continue to see strong channel performance, as referrals, primarily from benefit brokers and financial advisors, once again represented more than 25% of new business for the third quarter, driven by our modern platform, third-party integrations and API capabilities. We remain committed to investing in and supporting the broker channel going forward – with the goal of continuing to deliver real value and true partnership and support to our referring brokers and clients. Additionally, we continue to return capital to shareholders with $150 million or approximately 800,000 shares repurchased through April of this fiscal year,” said Toby Williams, President and Chief Executive Officer of Paylocity.
Company Overview
Founded by payroll software veteran Steve Sarowitz in 1997, Paylocity (NASDAQ: PCTY) is a provider of payroll and HR software for small and medium-sized enterprises.
Sales Growth
A company’s long-term sales performance can indicate its overall quality. Any business can put up a good quarter or two, but the best consistently grow over the long haul. Thankfully, Paylocity’s 25.2% annualized revenue growth over the last three years was solid. Its growth beat the average software company and shows its offerings resonate with customers.
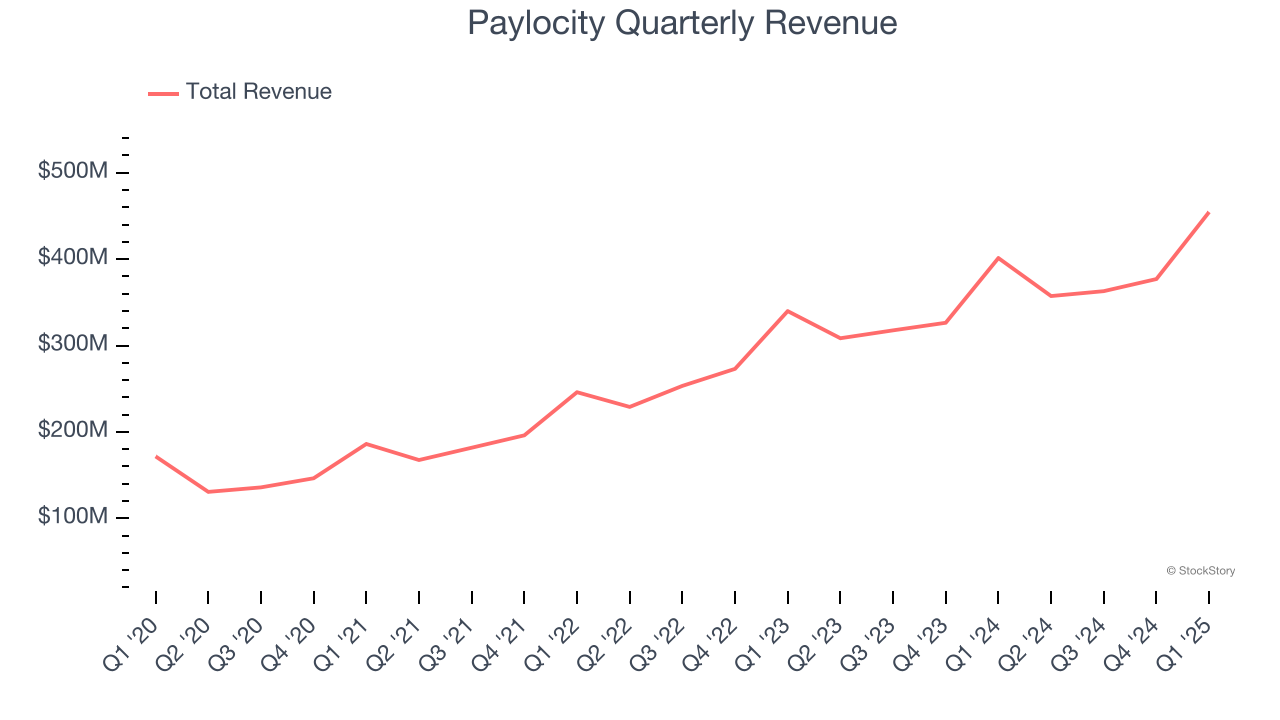
This quarter, Paylocity reported year-on-year revenue growth of 13.3%, and its $454.5 million of revenue exceeded Wall Street’s estimates by 2.9%. Company management is currently guiding for a 8.6% year-on-year increase in sales next quarter.
Looking further ahead, sell-side analysts expect revenue to grow 7.9% over the next 12 months, a deceleration versus the last three years. This projection is underwhelming and suggests its products and services will see some demand headwinds.
Today’s young investors won’t have read the timeless lessons in Gorilla Game: Picking Winners In High Technology because it was written more than 20 years ago when Microsoft and Apple were first establishing their supremacy. But if we apply the same principles, then enterprise software stocks leveraging their own generative AI capabilities may well be the Gorillas of the future. So, in that spirit, we are excited to present our Special Free Report on a profitable, fast-growing enterprise software stock that is already riding the automation wave and looking to catch the generative AI next.
Customer Acquisition Efficiency
The customer acquisition cost (CAC) payback period measures the months a company needs to recoup the money spent on acquiring a new customer. This metric helps assess how quickly a business can break even on its sales and marketing investments.
Paylocity is very efficient at acquiring new customers, and its CAC payback period checked in at 23.1 months this quarter. The company’s rapid recovery of its customer acquisition costs indicates it has a highly differentiated product offering and a strong brand reputation. These dynamics give Paylocity more resources to pursue new product initiatives while maintaining the flexibility to increase its sales and marketing investments. 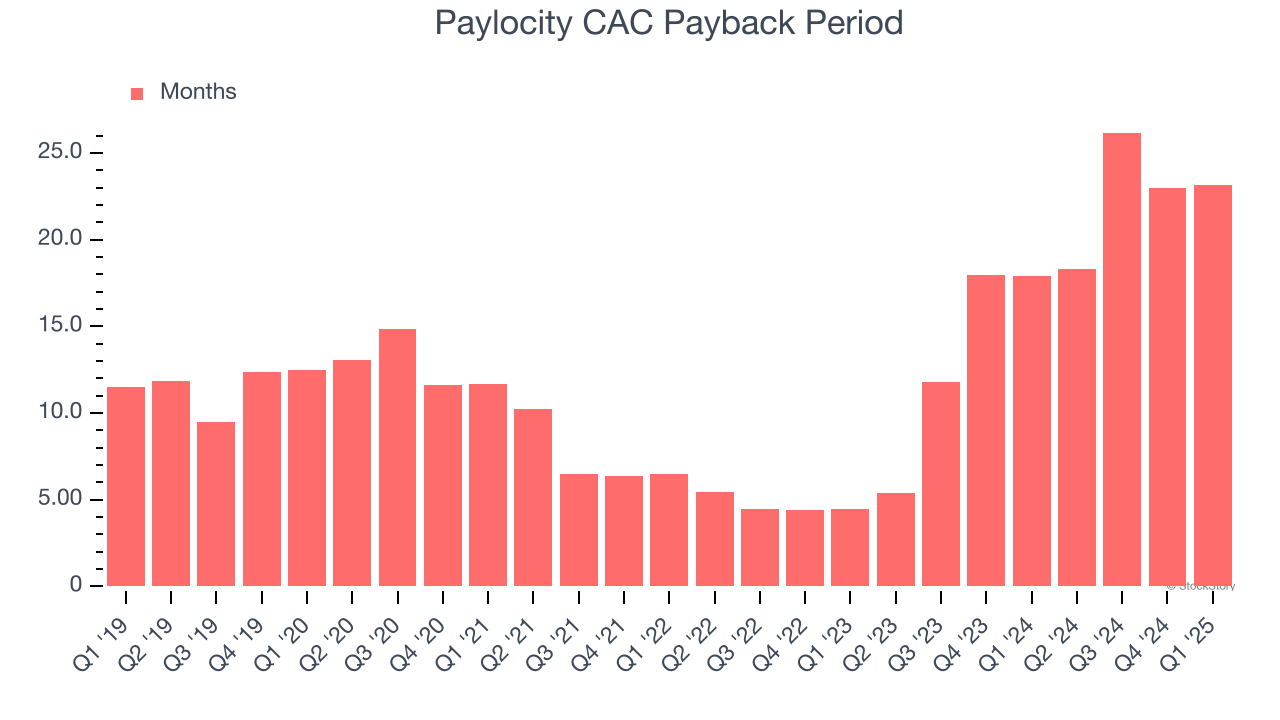
Key Takeaways from Paylocity’s Q1 Results
We were impressed by how significantly Paylocity blew past analysts’ EBITDA expectations this quarter. We were also glad its full-year EBITDA guidance trumped Wall Street’s estimates. Zooming out, we think this was a solid print. The stock traded up 1.5% to $197.17 immediately following the results.
Sure, Paylocity had a solid quarter, but if we look at the bigger picture, is this stock a buy? If you’re making that decision, you should consider the bigger picture of valuation, business qualities, as well as the latest earnings. We cover that in our actionable full research report which you can read here, it’s free.