Satellite radio and media company Sirius XM (NASDAQ: SIRI) fell short of the market’s revenue expectations in Q1 CY2025, with sales falling 4.3% year on year to $2.07 billion. On the other hand, the company’s outlook for the full year was close to analysts’ estimates with revenue guided to $8.5 billion at the midpoint. Its GAAP profit of $0.59 per share was 10% below analysts’ consensus estimates.
Is now the time to buy Sirius XM? Find out by accessing our full research report, it’s free.
Sirius XM (SIRI) Q1 CY2025 Highlights:
- Revenue: $2.07 billion vs analyst estimates of $2.08 billion (4.3% year-on-year decline, 0.6% miss)
- EPS (GAAP): $0.59 vs analyst expectations of $0.66 (10% miss)
- Adjusted EBITDA: $629 million vs analyst estimates of $607.3 million (30.4% margin, 3.6% beat)
- The company reconfirmed its revenue guidance for the full year of $8.5 billion at the midpoint
- EBITDA guidance for the full year is $2.6 billion at the midpoint, above analyst estimates of $2.58 billion
- Operating Margin: 18.7%, down from 20.2% in the same quarter last year
- Free Cash Flow Margin: 2.7%, down from 6.2% in the same quarter last year
- Subscribers: 8.19 million
- Market Capitalization: $7.25 billion
Company Overview
Known for its commercial-free music channels, Sirius XM (NASDAQ: SIRI) is a broadcasting company that provides satellite radio and online radio services across North America.
Sales Growth
A company’s long-term performance is an indicator of its overall quality. Even a bad business can shine for one or two quarters, but a top-tier one grows for years. Unfortunately, Sirius XM’s 1.5% annualized revenue growth over the last five years was weak. This fell short of our benchmarks and is a tough starting point for our analysis.
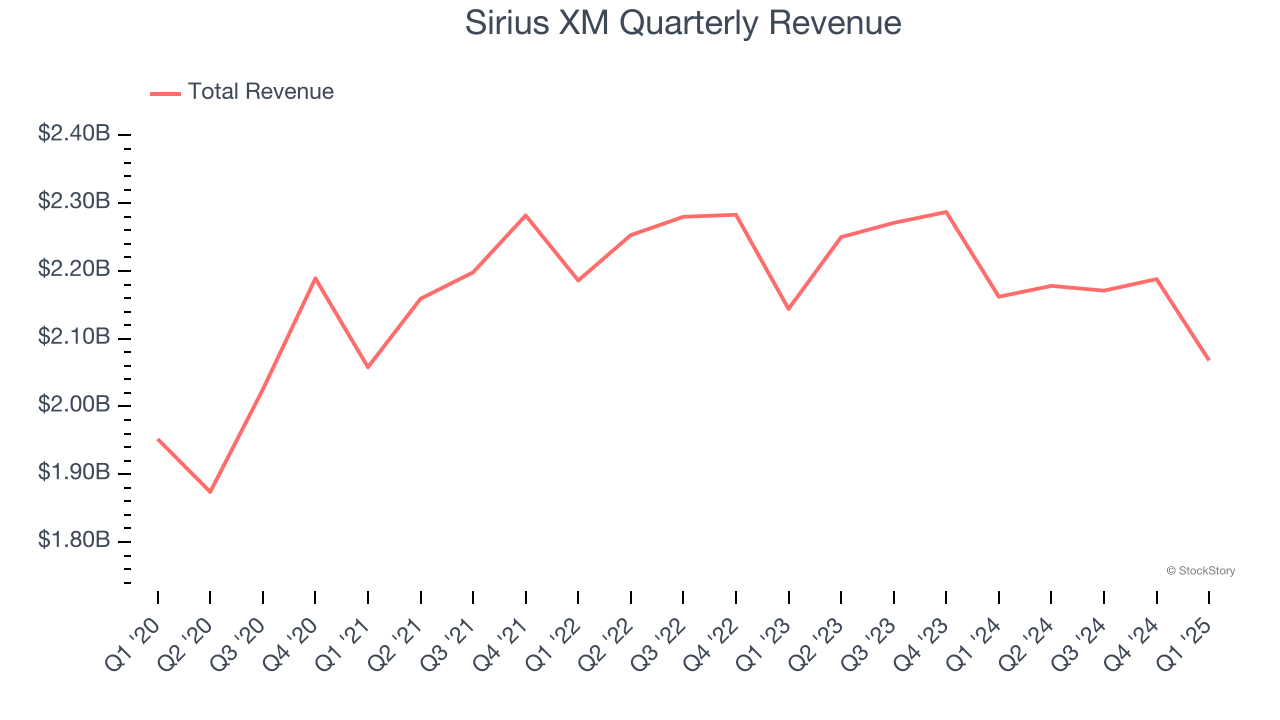
Long-term growth is the most important, but within consumer discretionary, product cycles are short and revenue can be hit-driven due to rapidly changing trends and consumer preferences. Sirius XM’s performance shows it grew in the past but relinquished its gains over the last two years, as its revenue fell by 2% annually. 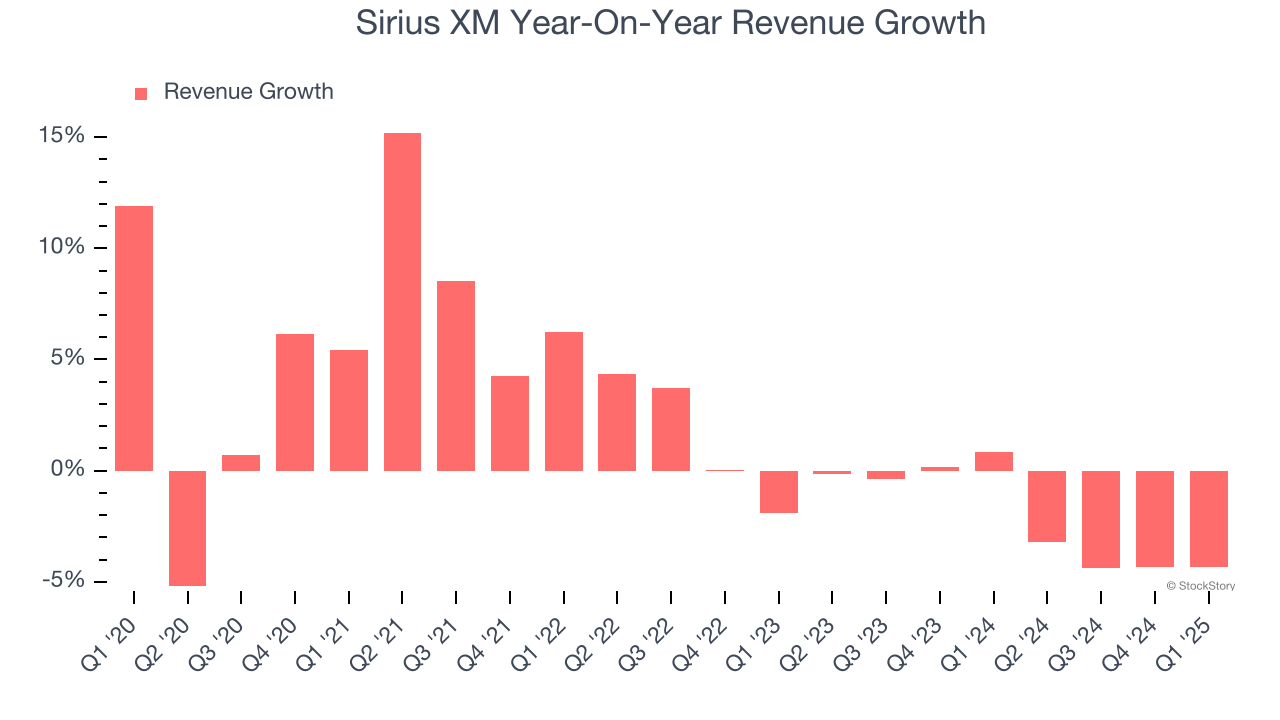
This quarter, Sirius XM missed Wall Street’s estimates and reported a rather uninspiring 4.3% year-on-year revenue decline, generating $2.07 billion of revenue.
Looking ahead, sell-side analysts expect revenue to decline by 1.2% over the next 12 months, similar to its two-year rate. This projection is underwhelming and indicates its newer products and services will not lead to better top-line performance yet.
Unless you’ve been living under a rock, it should be obvious by now that generative AI is going to have a huge impact on how large corporations do business. While Nvidia and AMD are trading close to all-time highs, we prefer a lesser-known (but still profitable) stock benefiting from the rise of AI. Click here to access our free report one of our favorites growth stories.
Operating Margin
Sirius XM’s operating margin has shrunk over the last 12 months and averaged 2.7% over the last two years. The company’s profitability was mediocre for a consumer discretionary business and shows it couldn’t pass its higher operating expenses onto its customers.
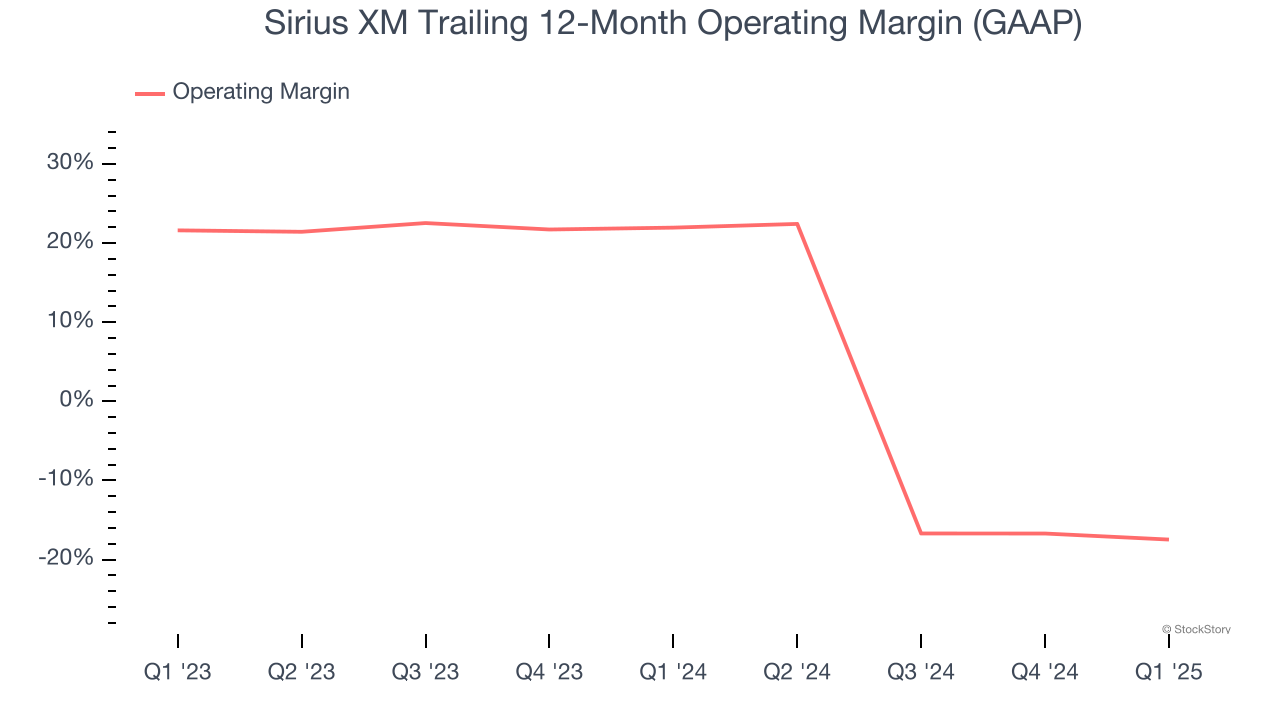
In Q1, Sirius XM generated an operating profit margin of 18.7%, down 1.5 percentage points year on year. This reduction is quite minuscule and indicates the company’s overall cost structure has been relatively stable.
Earnings Per Share
We track the long-term change in earnings per share (EPS) for the same reason as long-term revenue growth. Compared to revenue, however, EPS highlights whether a company’s growth is profitable.
Sadly for Sirius XM, its EPS declined by 37.4% annually over the last five years while its revenue grew by 1.5%. This tells us the company became less profitable on a per-share basis as it expanded due to non-fundamental factors such as interest expenses and taxes.
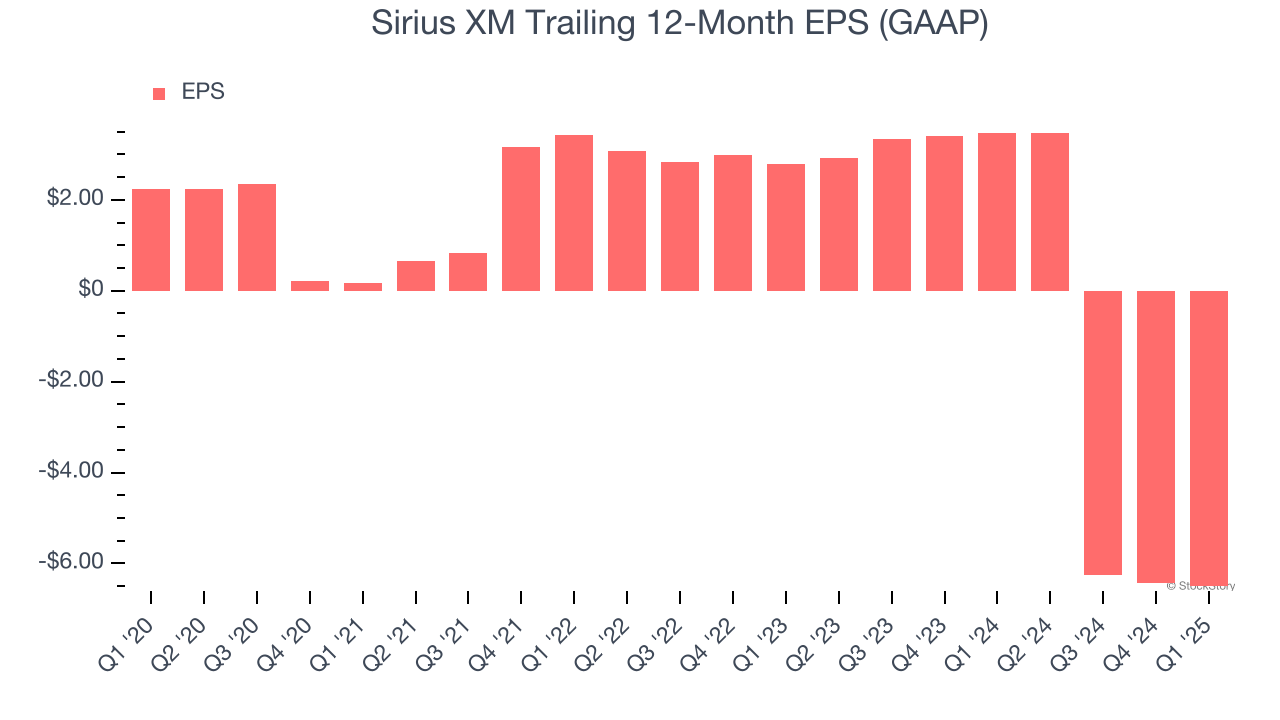
In Q1, Sirius XM reported EPS at $0.59, down from $0.67 in the same quarter last year. This print missed analysts’ estimates. Over the next 12 months, Wall Street is optimistic. Analysts forecast Sirius XM’s full-year EPS of negative $6.51 will flip to positive $3.00.
Key Takeaways from Sirius XM’s Q1 Results
It was encouraging to see Sirius XM beat analysts’ EBITDA and full-year EBITDA guidance expectations this quarter. On the other hand, its EPS missed significantly and its revenue fell slightly short of Wall Street’s estimates. Overall, this quarter could have been better. The stock remained flat at $21.50 immediately after reporting.
So do we think Sirius XM is an attractive buy at the current price? What happened in the latest quarter matters, but not as much as longer-term business quality and valuation, when deciding whether to invest in this stock. We cover that in our actionable full research report which you can read here, it’s free.