
Restaurant company Cheesecake Factory (NASDAQ: CAKE) met Wall Street’s revenue expectations in Q1 CY2025, with sales up 4% year on year to $927.2 million. Its non-GAAP profit of $0.93 per share was 13.9% above analysts’ consensus estimates.
Is now the time to buy The Cheesecake Factory? Find out by accessing our full research report, it’s free.
The Cheesecake Factory (CAKE) Q1 CY2025 Highlights:
- Revenue: $927.2 million vs analyst estimates of $925.8 million (4% year-on-year growth, in line)
- Adjusted EPS: $0.93 vs analyst estimates of $0.82 (13.9% beat)
- Adjusted EBITDA: $79.42 million vs analyst estimates of $72.87 million (8.6% margin, 9% beat)
- Operating Margin: 5.6%, up from 4.4% in the same quarter last year
- Locations: 388 at quarter end, up from 369 in the same quarter last year
- Same-Store Sales rose 1% year on year (-0.3% in the same quarter last year)
- Market Capitalization: $2.49 billion
“Our first quarter results reflect a strong start to the year as we delivered solid topline revenue, margins and earnings, reflecting continued positive momentum across our business,” said David Overton, Chairman and Chief Executive Officer.
Company Overview
Celebrated for its delicious (and free) brown bread, gigantic portions, and delectable desserts, Cheesecake Factory (NASDAQ: CAKE) is an iconic American restaurant chain that also owns and operates a portfolio of separate restaurant brands.
Sit-Down Dining
Sit-down restaurants offer a complete dining experience with table service. These establishments span various cuisines and are renowned for their warm hospitality and welcoming ambiance, making them perfect for family gatherings, special occasions, or simply unwinding. Their extensive menus range from appetizers to indulgent desserts and wines and cocktails. This space is extremely fragmented and competition includes everything from publicly-traded companies owning multiple chains to single-location mom-and-pop restaurants.
Sales Growth
Reviewing a company’s long-term sales performance reveals insights into its quality. Any business can put up a good quarter or two, but the best consistently grow over the long haul.
With $3.62 billion in revenue over the past 12 months, The Cheesecake Factory is one of the larger restaurant chains in the industry and benefits from a well-known brand that influences consumer purchasing decisions.
As you can see below, The Cheesecake Factory’s sales grew at a decent 7.5% compounded annual growth rate over the last six years (we compare to 2019 to normalize for COVID-19 impacts) as it opened new restaurants and increased sales at existing, established dining locations.
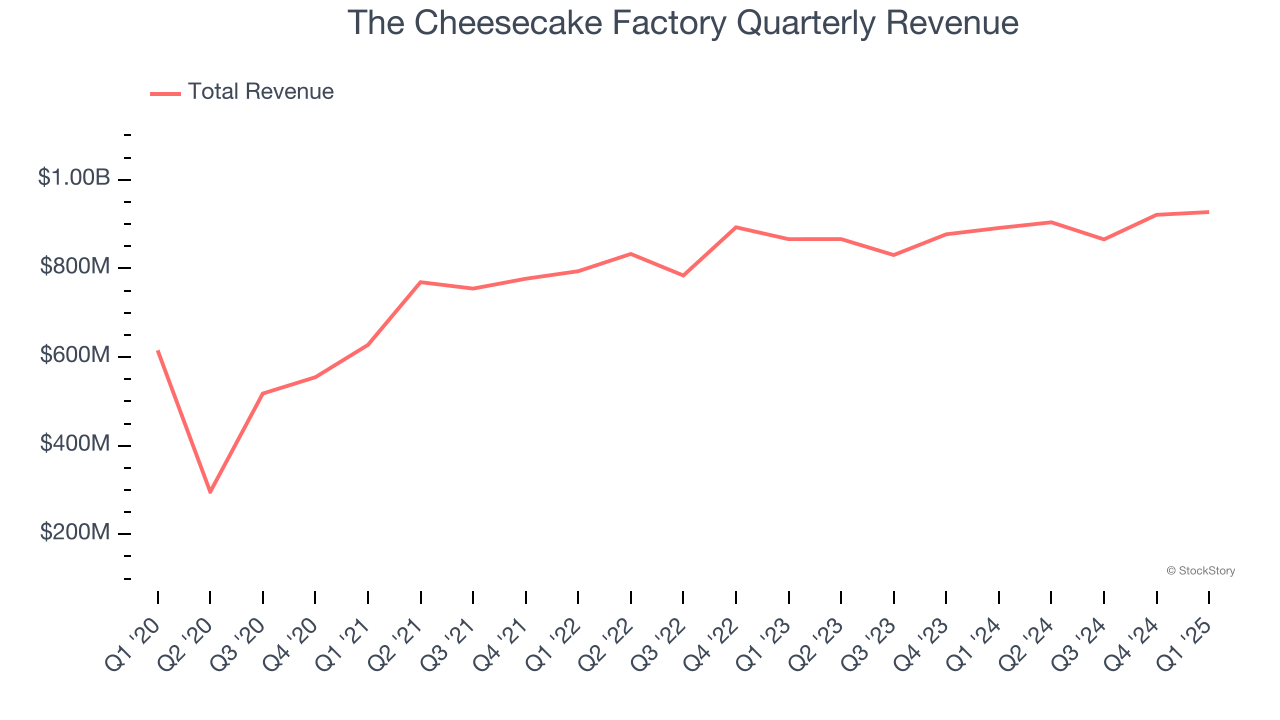
This quarter, The Cheesecake Factory grew its revenue by 4% year on year, and its $927.2 million of revenue was in line with Wall Street’s estimates.
Looking ahead, sell-side analysts expect revenue to grow 6.1% over the next 12 months, similar to its six-year rate. This projection doesn't excite us and suggests its menu offerings will face some demand challenges.
Unless you’ve been living under a rock, it should be obvious by now that generative AI is going to have a huge impact on how large corporations do business. While Nvidia and AMD are trading close to all-time highs, we prefer a lesser-known (but still profitable) stock benefiting from the rise of AI. Click here to access our free report one of our favorites growth stories.
Restaurant Performance
Number of Restaurants
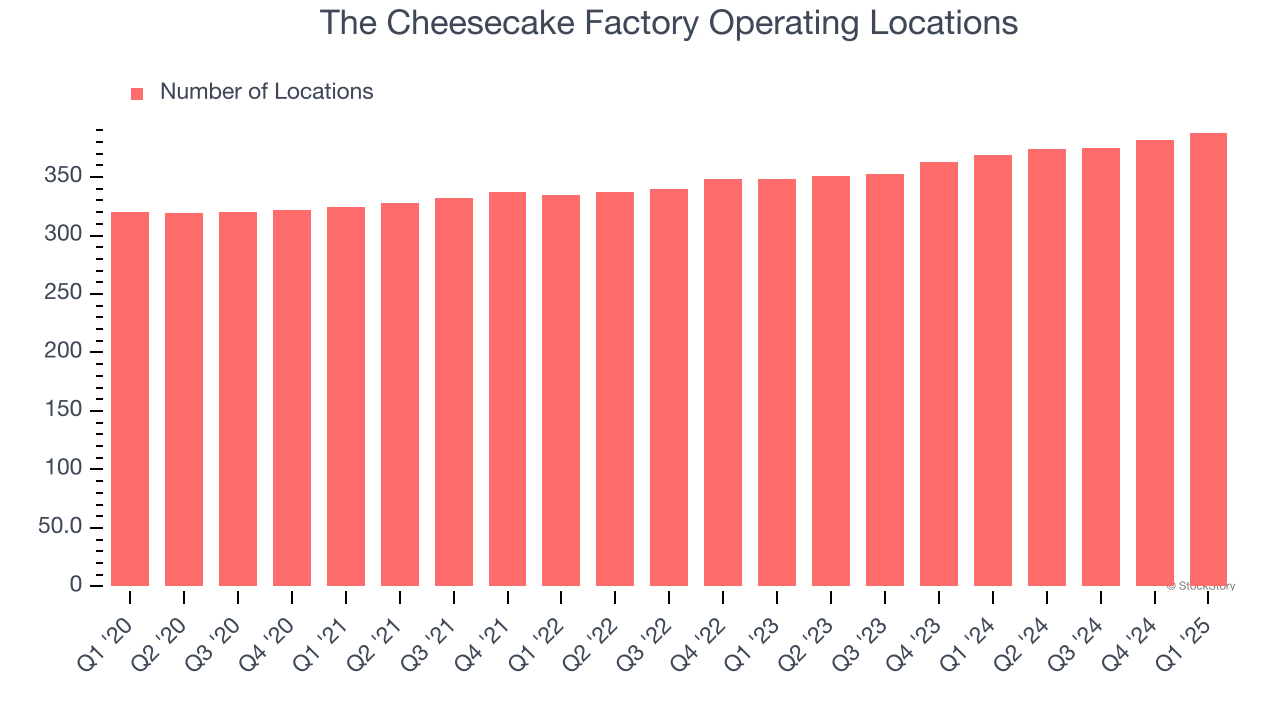
The Cheesecake Factory operated 388 locations in the latest quarter. It has opened new restaurants at a rapid clip over the last two years, averaging 5.2% annual growth, much faster than the broader restaurant sector.
When a chain opens new restaurants, it usually means it’s investing for growth because there’s healthy demand for its meals and there are markets where its concepts have few or no locations.
Same-Store Sales
The change in a company's restaurant base only tells one side of the story. The other is the performance of its existing locations, which informs management teams whether they should expand or downsize their physical footprints. Same-store sales gives us insight into this topic because it measures organic growth at restaurants open for at least a year.
The Cheesecake Factory’s demand within its existing dining locations has been relatively stable over the last two years but was below most restaurant chains. On average, the company’s same-store sales have grown by 1.6% per year. This performance suggests it should consider improving its foot traffic and efficiency before expanding its restaurant base.
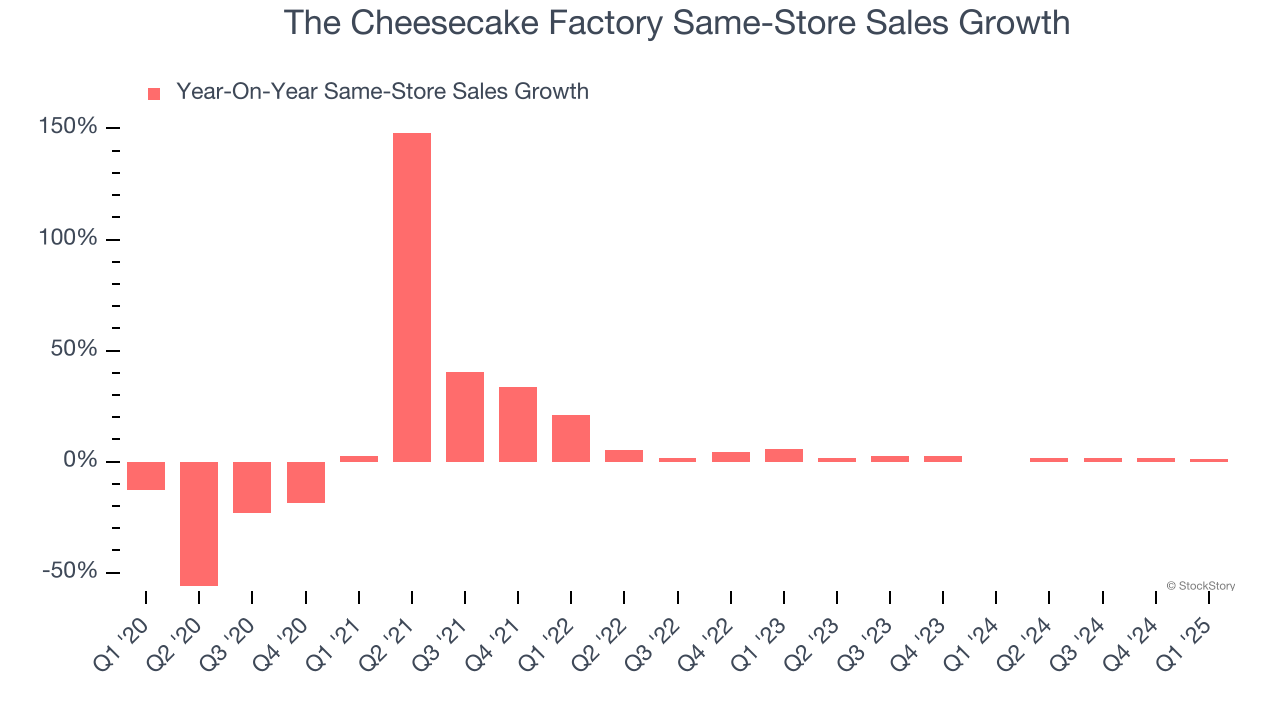
In the latest quarter, The Cheesecake Factory’s same-store sales rose 1% year on year. This performance was more or less in line with its historical levels.
Key Takeaways from The Cheesecake Factory’s Q1 Results
We were impressed by how significantly The Cheesecake Factory blew past analysts’ EPS and EBITDA expectations this quarter. Overall, we think this was a decent quarter with some key metrics above expectations. The market seemed to be hoping for more, and the stock traded down 1.9% to $49.49 immediately following the results.
Is The Cheesecake Factory an attractive investment opportunity right now? We think that the latest quarter is only one piece of the longer-term business quality puzzle. Quality, when combined with valuation, can help determine if the stock is a buy. We cover that in our actionable full research report which you can read here, it’s free.


