Document technology company Xerox (NASDAQ: XRX) met Wall Street’s revenue expectations in Q1 CY2025, but sales fell by 3% year on year to $1.46 billion. Its GAAP loss of $0.75 per share increased from -$0.94 in the same quarter last year.
Is now the time to buy Xerox? Find out by accessing our full research report, it’s free.
Xerox (XRX) Q1 CY2025 Highlights:
- Revenue: $1.46 billion vs analyst estimates of $1.46 billion (3% year-on-year decline, in line)
- Adjusted EBITDA: $120 million vs analyst estimates of $165.8 million (8.2% margin, 27.6% miss)
- Operating Margin: 3.3%, up from -7.1% in the same quarter last year
- Free Cash Flow was -$109 million compared to -$89 million in the same quarter last year
- Market Capitalization: $554.7 million
"In a quarter marked by increasing levels of macroeconomic and trade policy uncertainty, our team remained focused on what we can control: the balanced execution of our Reinvention and delivering client success," said Steve Bandrowczak, CEO at Xerox.
Company Overview
Pioneering the modern office copier and inventing technologies like Ethernet and the laser printer, Xerox (NASDAQ: XRX) provides document management systems, printing technology, and workplace solutions to businesses of all sizes across the globe.
Sales Growth
A company’s long-term sales performance is one signal of its overall quality. Any business can put up a good quarter or two, but the best consistently grow over the long haul.
With $6.18 billion in revenue over the past 12 months, Xerox is one of the larger companies in the business services industry and benefits from a well-known brand that influences purchasing decisions. However, its scale is a double-edged sword because finding new avenues for growth becomes difficult when you already have a substantial market presence. To accelerate sales, Xerox likely needs to optimize its pricing or lean into new offerings and international expansion.
As you can see below, Xerox struggled to generate demand over the last five years. Its sales dropped by 6.7% annually, a rough starting point for our analysis.
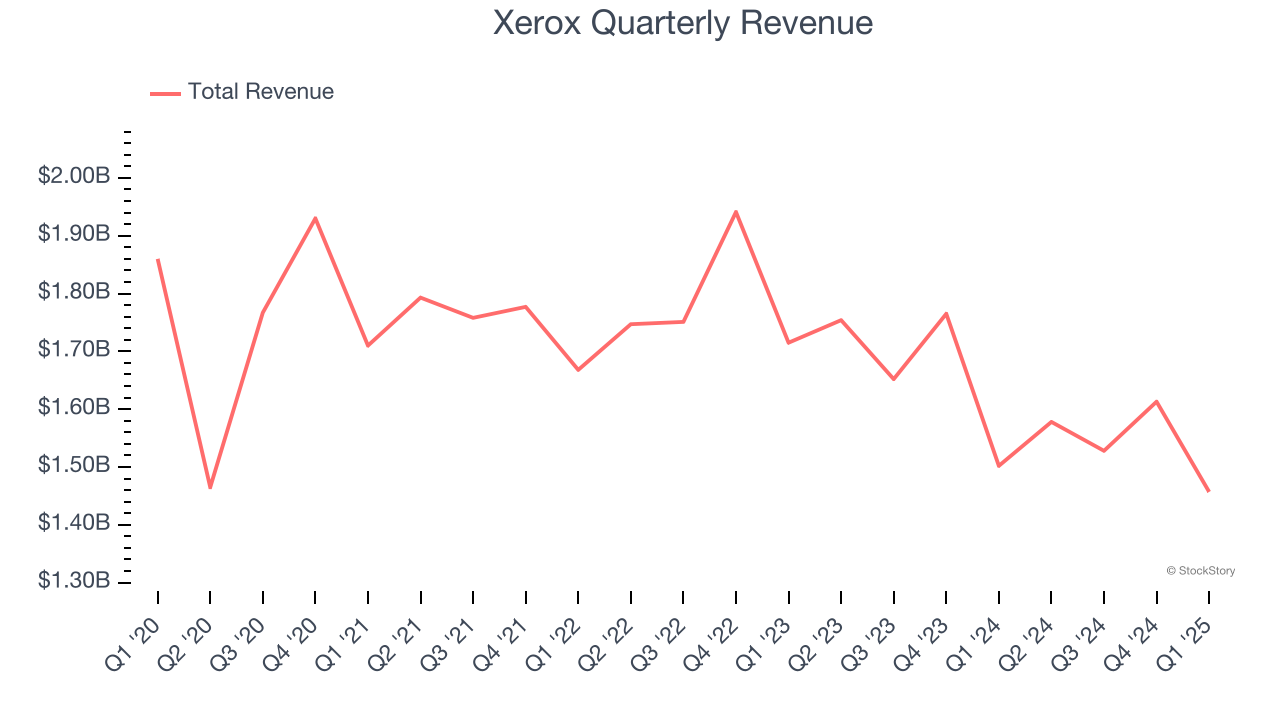
We at StockStory place the most emphasis on long-term growth, but within business services, a half-decade historical view may miss recent innovations or disruptive industry trends. Xerox’s annualized revenue declines of 7.1% over the last two years align with its five-year trend, suggesting its demand has consistently shrunk. 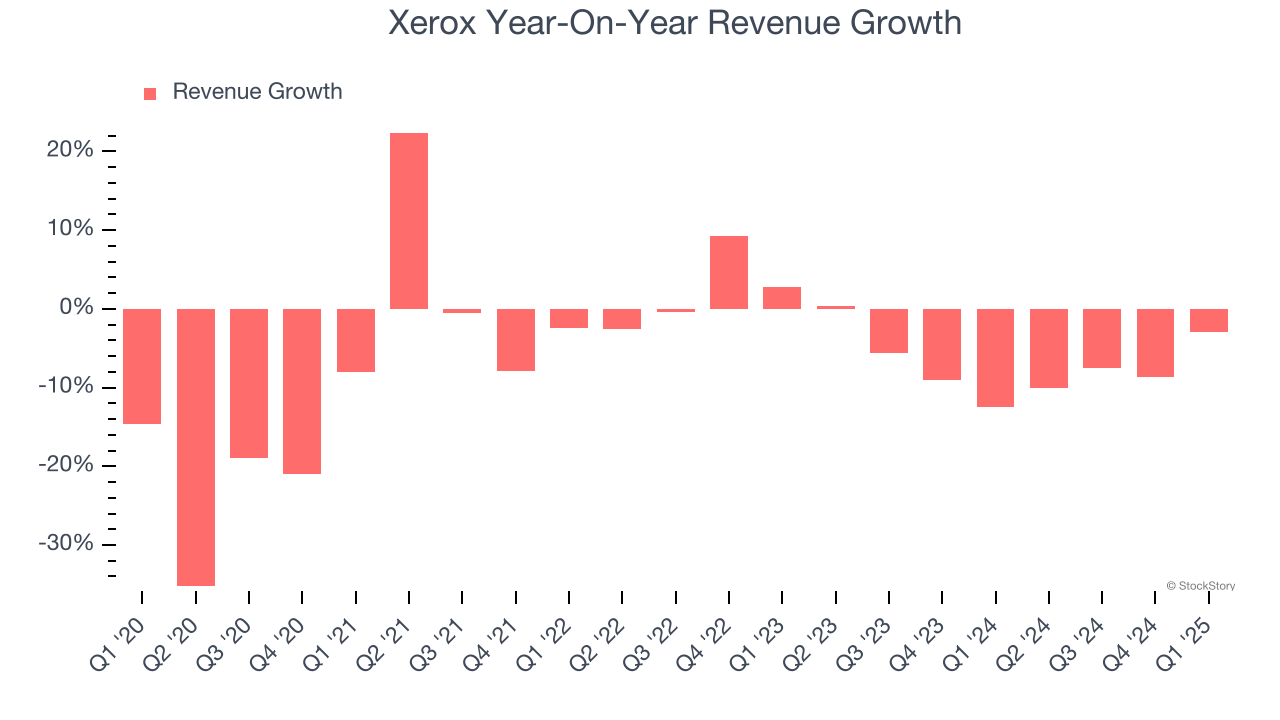
This quarter, Xerox reported a rather uninspiring 3% year-on-year revenue decline to $1.46 billion of revenue, in line with Wall Street’s estimates.
Looking ahead, sell-side analysts expect revenue to decline by 2.3% over the next 12 months. While this projection is better than its two-year trend, it's tough to feel optimistic about a company facing demand difficulties.
Software is eating the world and there is virtually no industry left that has been untouched by it. That drives increasing demand for tools helping software developers do their jobs, whether it be monitoring critical cloud infrastructure, integrating audio and video functionality, or ensuring smooth content streaming. Click here to access a free report on our 3 favorite stocks to play this generational megatrend.
Operating Margin
Operating margin is one of the best measures of profitability because it tells us how much money a company takes home after subtracting all core expenses, like marketing and R&D.
Although Xerox was profitable this quarter from an operational perspective, it’s generally struggled over a longer time period. Its expensive cost structure has contributed to an average operating margin of negative 4.3% over the last five years. Unprofitable business services companies require extra attention because they could get caught swimming naked when the tide goes out. It’s hard to trust that the business can endure a full cycle.
Analyzing the trend in its profitability, Xerox’s operating margin decreased by 19.5 percentage points over the last five years. Xerox’s performance was poor no matter how you look at it - it shows that costs were rising and it couldn’t pass them onto its customers.
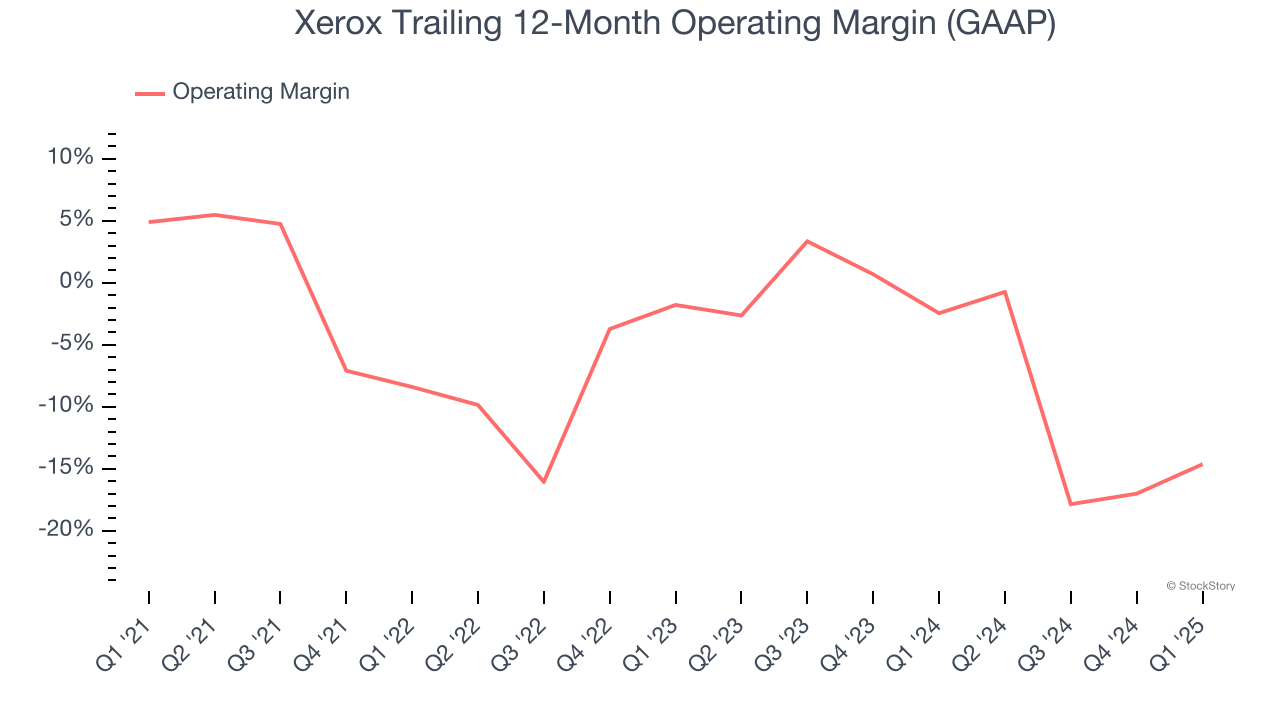
This quarter, Xerox generated an operating profit margin of 3.3%, up 10.4 percentage points year on year. This increase was a welcome development, especially since its revenue fell, showing it was more efficient because it scaled down its expenses.
Earnings Per Share
Revenue trends explain a company’s historical growth, but the long-term change in earnings per share (EPS) points to the profitability of that growth – for example, a company could inflate its sales through excessive spending on advertising and promotions.
Sadly for Xerox, its EPS declined by 36.5% annually over the last five years, more than its revenue. This tells us the company struggled because its fixed cost base made it difficult to adjust to shrinking demand.
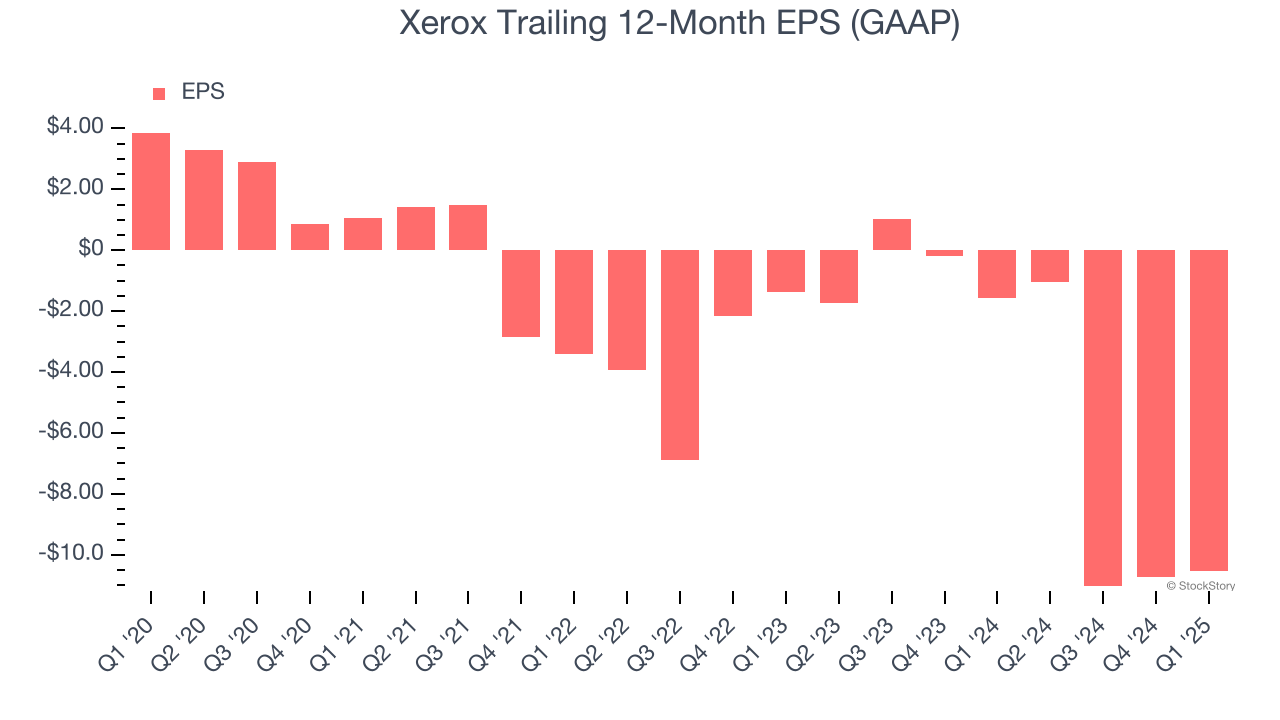
We can take a deeper look into Xerox’s earnings to better understand the drivers of its performance. As we mentioned earlier, Xerox’s operating margin improved this quarter but declined by 19.5 percentage points over the last five years. This was the most relevant factor (aside from the revenue impact) behind its lower earnings; taxes and interest expenses can also affect EPS but don’t tell us as much about a company’s fundamentals.
In Q1, Xerox reported EPS at negative $0.75, up from negative $0.94 in the same quarter last year. We also like to analyze expected EPS growth based on Wall Street analysts’ consensus projections, but there is insufficient data.
Key Takeaways from Xerox’s Q1 Results
We struggled to find many positives in these results as its revenue was in line and its EBITDA missed. However, the stock traded up 1.8% to $4.49 immediately following the results.
So do we think Xerox is an attractive buy at the current price? What happened in the latest quarter matters, but not as much as longer-term business quality and valuation, when deciding whether to invest in this stock. We cover that in our actionable full research report which you can read here, it’s free.