
Online study and academic help platform Chegg (NYSE: CHGG) reported revenue ahead of Wall Street’s expectations in Q1 CY2025, but sales fell by 30.4% year on year to $121.4 million. On the other hand, next quarter’s revenue guidance of $101 million was less impressive, coming in 9.2% below analysts’ estimates. Its non-GAAP loss of $0.06 per share was significantly below analysts’ consensus estimates.
Is now the time to buy Chegg? Find out by accessing our full research report, it’s free.
Chegg (CHGG) Q1 CY2025 Highlights:
- Revenue: $121.4 million vs analyst estimates of $114.7 million (30.4% year-on-year decline, 5.8% beat)
- Adjusted EPS: -$0.06 vs analyst estimates of $0 (significant miss)
- Adjusted EBITDA: $19.27 million vs analyst estimates of $13.43 million (15.9% margin, 43.5% beat)
- Revenue Guidance for Q2 CY2025 is $101 million at the midpoint, below analyst estimates of $111.3 million
- EBITDA guidance for Q2 CY2025 is $16.5 million at the midpoint, above analyst estimates of $16.15 million
- Operating Margin: -23.9%, down from -1.4% in the same quarter last year
- Free Cash Flow Margin: 13.1%, up from 3.4% in the previous quarter
- Services Subscribers: 3.2 million, down 1.46 million year on year
- Market Capitalization: $72.71 million
“In Q1, we exceeded our revenue and adjusted EBITDA expectations, delivered $16 million of free cash flow and continued to diversify our revenue streams. We are encouraged by the conversations in our strategic alternatives process and the value these organizations see in our business,” said Nathan Schultz, Chief Executive Officer & President of Chegg,
Company Overview
Started as a physical textbook rental service, Chegg (NYSE: CHGG) is now a digital platform addressing student pain points by providing study and academic assistance.
Sales Growth
A company’s long-term sales performance is one signal of its overall quality. Even a bad business can shine for one or two quarters, but a top-tier one grows for years. Over the last three years, Chegg’s demand was weak and its revenue declined by 10.2% per year. This was below our standards and suggests it’s a low quality business.
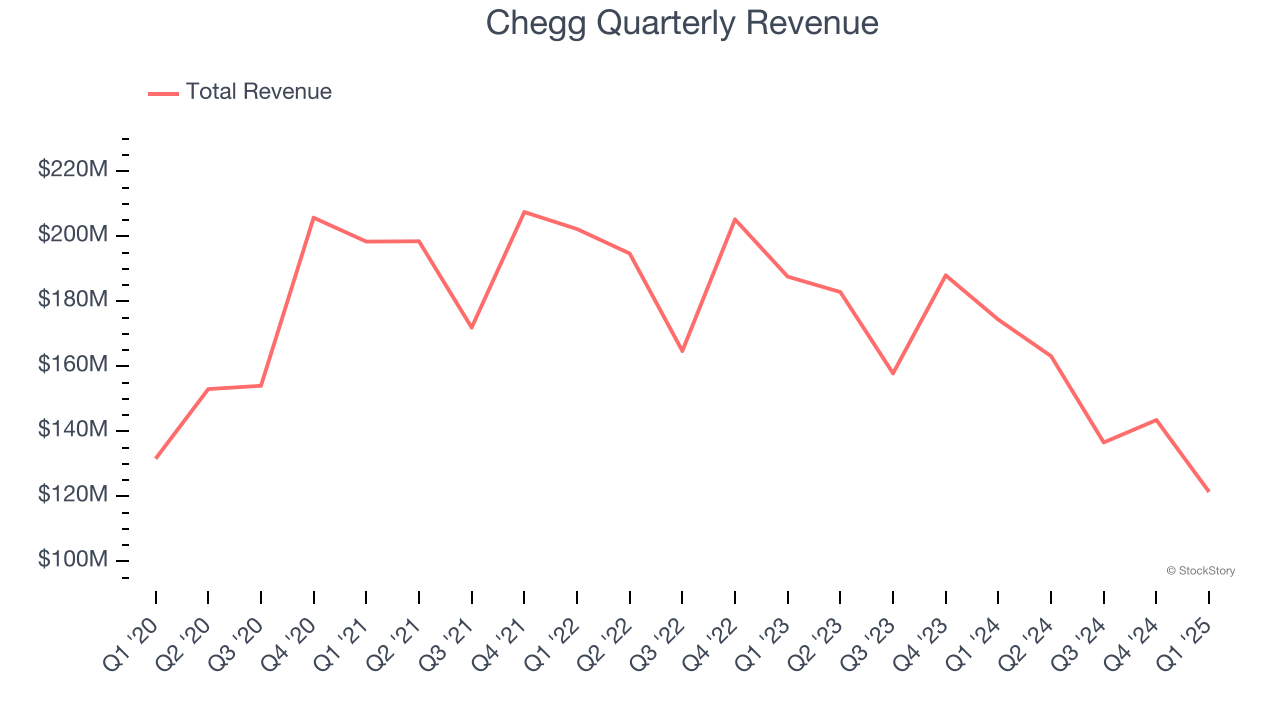
This quarter, Chegg’s revenue fell by 30.4% year on year to $121.4 million but beat Wall Street’s estimates by 5.8%. Company management is currently guiding for a 38.1% year-on-year decline in sales next quarter.
Looking further ahead, sell-side analysts expect revenue to decline by 25.8% over the next 12 months, a deceleration versus the last three years. This projection is underwhelming and implies its products and services will face some demand challenges.
Unless you’ve been living under a rock, it should be obvious by now that generative AI is going to have a huge impact on how large corporations do business. While Nvidia and AMD are trading close to all-time highs, we prefer a lesser-known (but still profitable) stock benefiting from the rise of AI. Click here to access our free report one of our favorites growth stories.
Services Subscribers
User Growth
As a subscription-based app, Chegg generates revenue growth by expanding both its subscriber base and the amount each subscriber spends over time.
Chegg struggled with new customer acquisition over the last two years as its services subscribers have declined by 13.4% annually to 3.2 million in the latest quarter. This performance isn't ideal because internet usage is secular, meaning there are typically unaddressed market opportunities. If Chegg wants to accelerate growth, it likely needs to enhance the appeal of its current offerings or innovate with new products. 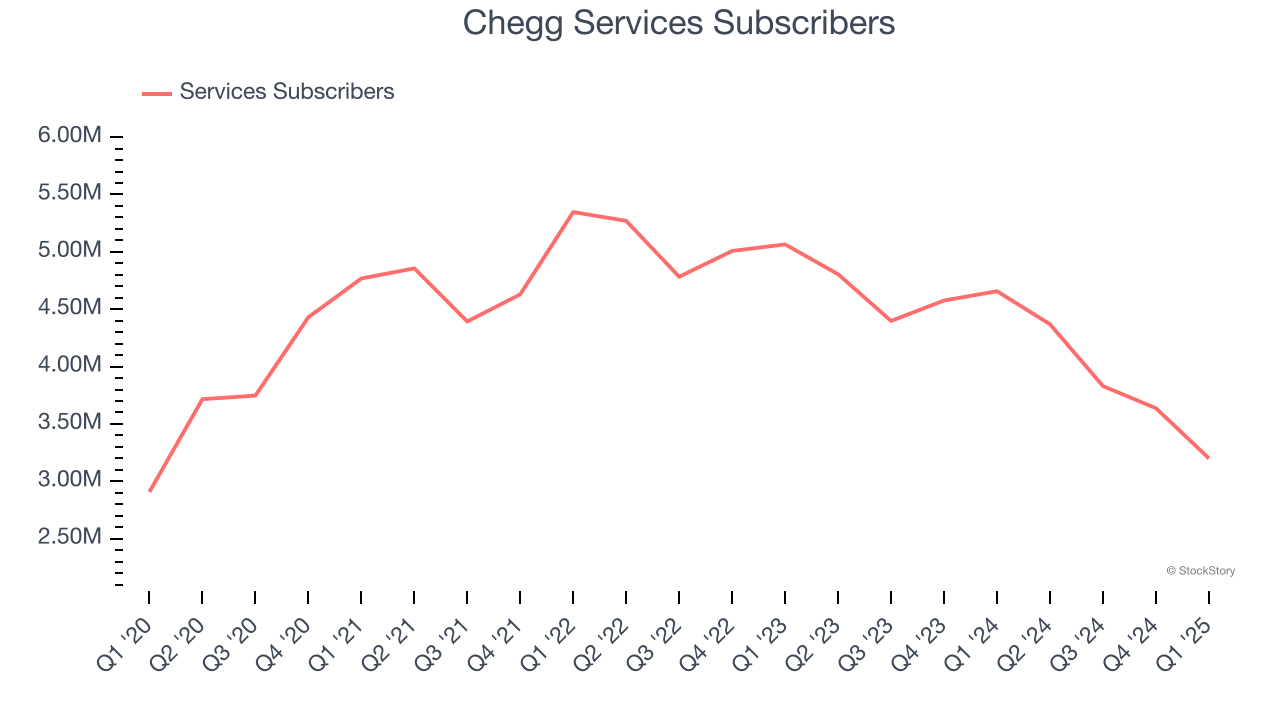
In Q1, Chegg’s services subscribers once again decreased by 1.46 million, a 31.3% drop since last year. The quarterly print was lower than its two-year result, suggesting its new initiatives aren’t moving the needle for users yet.
Revenue Per User
Average revenue per user (ARPU) is a critical metric to track because it measures how much the average user spends. ARPU is also a key indicator of how valuable its users are (and can be over time).
Chegg’s ARPU has been roughly flat over the last two years. This raises questions about its platform’s health when paired with its declining services subscribers. If Chegg wants to increase its users, it must either develop new features or provide some existing ones for free. 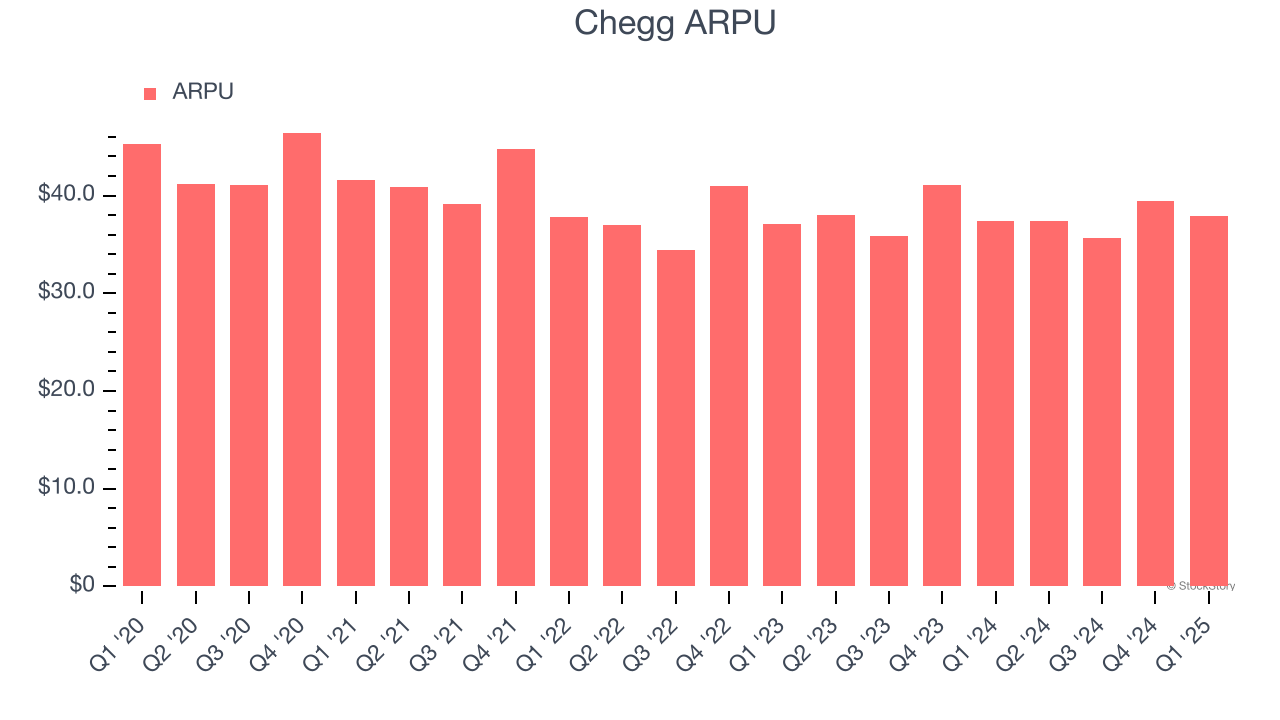
This quarter, Chegg’s ARPU clocked in at $37.93. It grew by 1.3% year on year, faster than its services subscribers.
Key Takeaways from Chegg’s Q1 Results
We were impressed by how significantly Chegg blew past analysts’ EBITDA expectations this quarter. We were also glad its revenue outperformed Wall Street’s estimates. On the other hand, its number of users declined and its number of services subscribers fell short of Wall Street’s estimates. Overall, this quarter could have been better, but expectations for this company are quite low. The stock traded up 2.7% to $0.70 immediately after reporting.
Is Chegg an attractive investment opportunity right now? When making that decision, it’s important to consider its valuation, business qualities, as well as what has happened in the latest quarter. We cover that in our actionable full research report which you can read here, it’s free.


