The end of an earnings season can be a great time to discover new stocks and assess how companies are handling the current business environment. Let’s take a look at how Offerpad (NYSE: OPAD) and the rest of the real estate services stocks fared in Q1.
Technology has been a double-edged sword in real estate services. On the one hand, internet listings are effective at disseminating information far and wide, casting a wide net for buyers and sellers to increase the chances of transactions. On the other hand, digitization in the real estate market could potentially disintermediate key players like agents who use information asymmetries to their advantage.
The 13 real estate services stocks we track reported a satisfactory Q1. As a group, revenues beat analysts’ consensus estimates by 2% while next quarter’s revenue guidance was 0.8% below.
While some real estate services stocks have fared somewhat better than others, they have collectively declined. On average, share prices are down 1.1% since the latest earnings results.
Offerpad (NYSE: OPAD)
Known for giving homeowners cash offers within 24 hours, Offerpad (NYSE: OPAD) operates a tech-enabled platform specializing in direct home buying and selling solutions.
Offerpad reported revenues of $160.7 million, down 43.7% year on year. This print fell short of analysts’ expectations by 3.1%. Overall, it was a slower quarter for the company with a miss of analysts’ homes sold and adjusted operating income estimates.
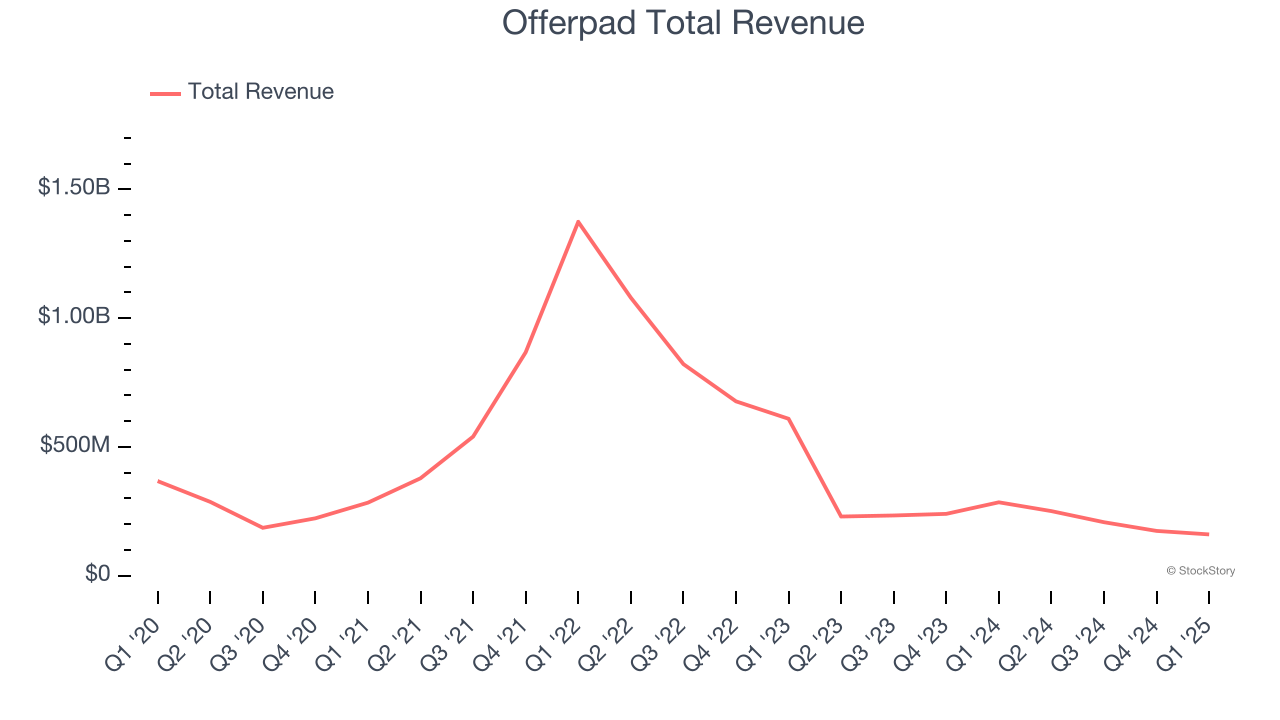
Offerpad delivered the slowest revenue growth of the whole group. The market was likely pricing in the results, and the stock is flat since reporting. It currently trades at $1.05.
Read our full report on Offerpad here, it’s free.
Best Q1: The Real Brokerage (NASDAQ: REAX)
Founded in Toronto, Canada in 2014, The Real Brokerage (NASDAQ: REAX) is a technology-driven real estate brokerage firm combining a tech-centric model with an agent-centric philosophy.
The Real Brokerage reported revenues of $354 million, up 76.3% year on year, outperforming analysts’ expectations by 6.3%. The business had a stunning quarter with an impressive beat of analysts’ EPS estimates and a solid beat of analysts’ EBITDA estimates.
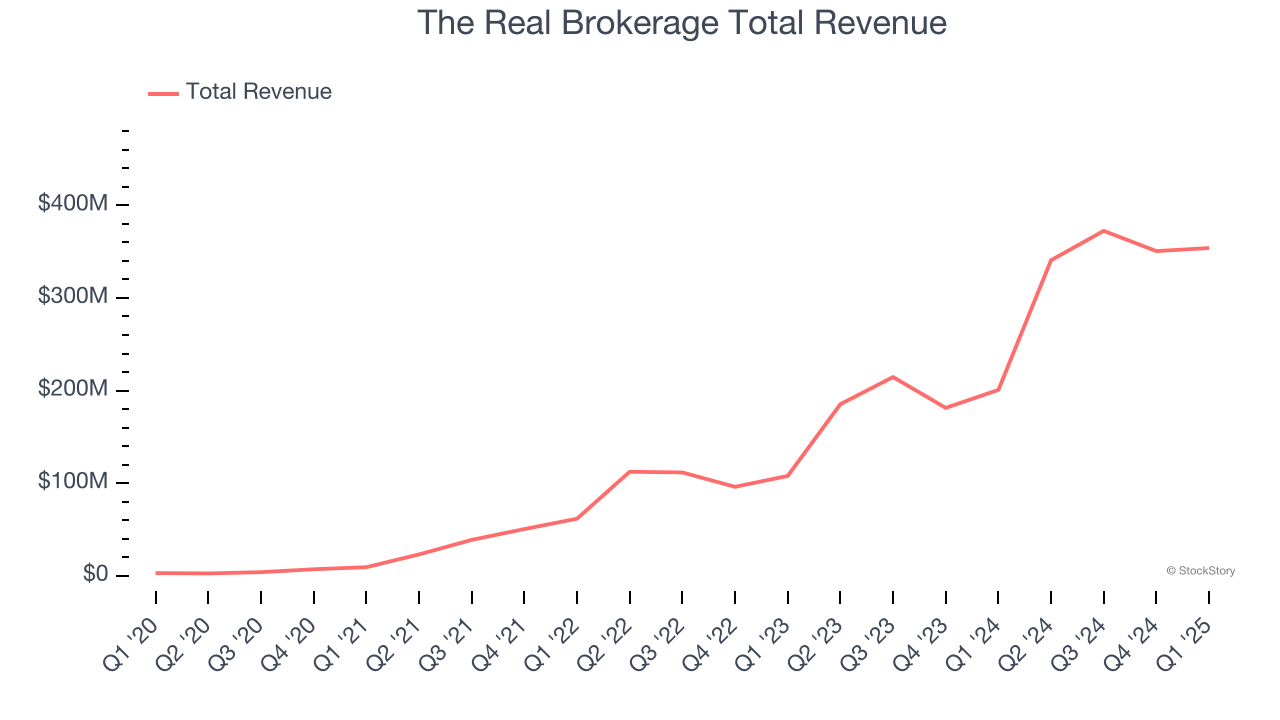
The Real Brokerage achieved the fastest revenue growth among its peers. However, the results were likely priced into the stock as it’s traded sideways since reporting. Shares currently sit at $4.45.
Is now the time to buy The Real Brokerage? Access our full analysis of the earnings results here, it’s free.
Weakest Q1: eXp World (NASDAQ: EXPI)
Founded in 2009, eXp World (NASDAQ: EXPI) is a real estate company known for its virtual, cloud-based approach to real estate brokerage.
eXp World reported revenues of $954.9 million, up 1.3% year on year, falling short of analysts’ expectations by 4%. It was a disappointing quarter as it posted a significant miss of analysts’ adjusted operating income estimates.
As expected, the stock is down 13.5% since the results and currently trades at $7.50.
Read our full analysis of eXp World’s results here.
Opendoor (NASDAQ: OPEN)
Founded by real estate guru Eric Wu, Opendoor (NASDAQ: OPEN) offers a technology-driven, convenient, and streamlined process to buy and sell homes.
Opendoor reported revenues of $1.15 billion, down 2.4% year on year. This print topped analysts’ expectations by 9.3%. It was an exceptional quarter as it also recorded EBITDA guidance for next quarter exceeding analysts’ expectations.
Opendoor scored the biggest analyst estimates beat among its peers. The stock is down 3% since reporting and currently trades at $0.68.
Read our full, actionable report on Opendoor here, it’s free.
Cushman & Wakefield (NYSE: CWK)
With expertise in the commercial real estate sector, Cushman & Wakefield (NYSE: CWK) is a global Chicago-based real estate firm offering a comprehensive range of services to clients.
Cushman & Wakefield reported revenues of $2.28 billion, up 4.6% year on year. This number surpassed analysts’ expectations by 2.5%. Overall, it was a very strong quarter as it also produced an impressive beat of analysts’ EPS estimates and a solid beat of analysts’ EBITDA estimates.
The stock is up 14% since reporting and currently trades at $10.26.
Read our full, actionable report on Cushman & Wakefield here, it’s free.
Market Update
Thanks to the Fed’s series of rate hikes in 2022 and 2023, inflation has cooled significantly from its post-pandemic highs, drawing closer to the 2% goal. This disinflation has occurred without severely impacting economic growth, suggesting the success of a soft landing. The stock market thrived in 2024, spurred by recent rate cuts (0.5% in September and 0.25% in November), and a notable surge followed Donald Trump’s presidential election win in November, propelling indices to historic highs. Nonetheless, the outlook for 2025 remains clouded by potential trade policy changes and corporate tax discussions, which could impact business confidence and growth. The path forward holds both optimism and caution as new policies take shape.
Want to invest in winners with rock-solid fundamentals? Check out our Top 5 Quality Compounder Stocks and add them to your watchlist. These companies are poised for growth regardless of the political or macroeconomic climate.
Join Paid Stock Investor Research
Help us make StockStory more helpful to investors like yourself. Join our paid user research session and receive a $50 Amazon gift card for your opinions. Sign up here.