
Fast-food chain Jack in the Box (NASDAQ: JACK) missed Wall Street’s revenue expectations in Q1 CY2025, with sales falling 7.8% year on year to $336.7 million. Its non-GAAP profit of $1.20 per share was 4.2% above analysts’ consensus estimates.
Is now the time to buy Jack in the Box? Find out by accessing our full research report, it’s free.
Jack in the Box (JACK) Q1 CY2025 Highlights:
- Revenue: $336.7 million vs analyst estimates of $341.6 million (7.8% year-on-year decline, 1.4% miss)
- Adjusted EPS: $1.20 vs analyst estimates of $1.15 (4.2% beat)
- Adjusted EBITDA: $66.46 million vs analyst estimates of $65.97 million (19.7% margin, 0.7% beat)
- Operating Margin: -46.7%, down from 14.8% in the same quarter last year
- Free Cash Flow was -$49.44 million compared to -$5.59 million in the same quarter last year
- Same-Store Sales fell 4.4% year on year (-2.3% in the same quarter last year)
- Market Capitalization: $491.4 million
“I am encouraged by our marketing plans in the back half of 2025, which we expect to energize sales despite the difficult industry-wide macro environment in which we continue to operate,” said Lance Tucker, Jack in the Box Chief Executive Officer.
Company Overview
Delighting customers since its inception in 1951, Jack in the Box (NASDAQ: JACK) is a distinctive fast-food chain known for its bold flavors, innovative menu items, and quirky marketing.
Sales Growth
A company’s long-term sales performance can indicate its overall quality. Even a bad business can shine for one or two quarters, but a top-tier one grows for years.
With $1.52 billion in revenue over the past 12 months, Jack in the Box is a mid-sized restaurant chain, which sometimes brings disadvantages compared to larger competitors benefiting from better brand awareness and economies of scale. On the bright side, it can still flex high growth rates because it’s working from a smaller revenue base.
As you can see below, Jack in the Box grew its sales at a decent 8.2% compounded annual growth rate over the last six years (we compare to 2019 to normalize for COVID-19 impacts) despite closing restaurants.
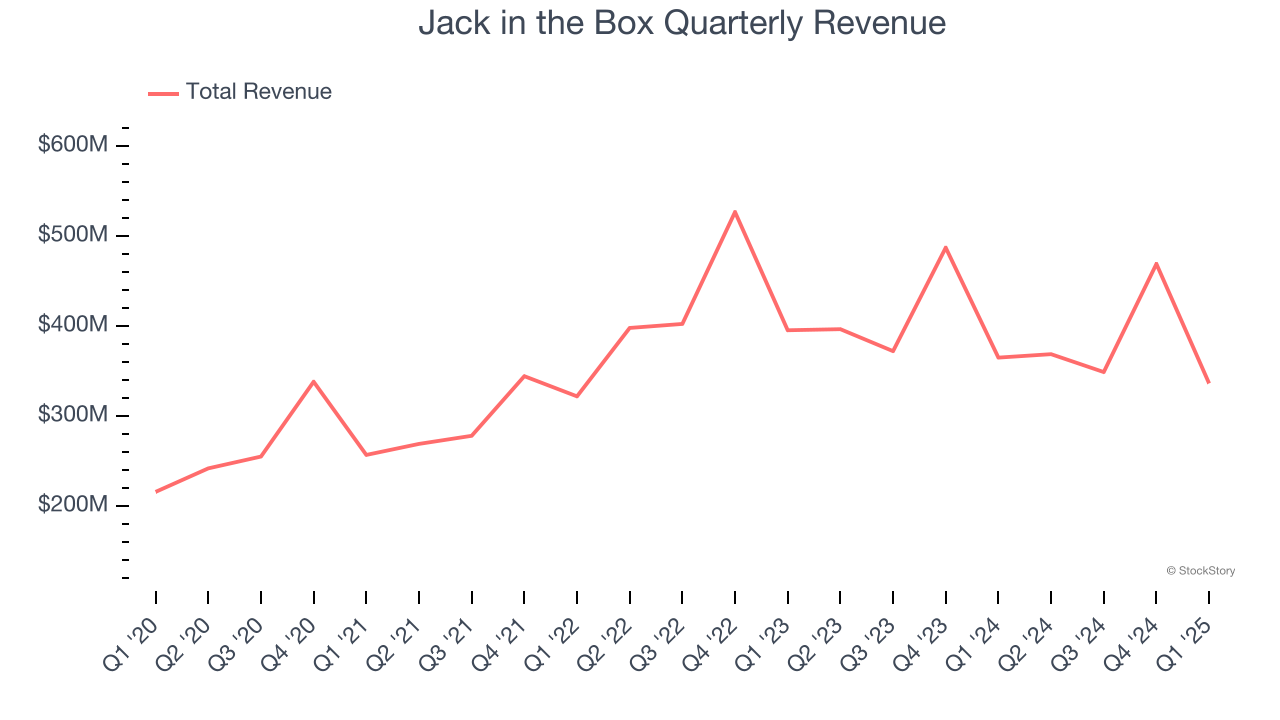
This quarter, Jack in the Box missed Wall Street’s estimates and reported a rather uninspiring 7.8% year-on-year revenue decline, generating $336.7 million of revenue.
Looking ahead, sell-side analysts expect revenue to decline by 1.9% over the next 12 months, a deceleration versus the last six years. This projection is underwhelming and implies its menu offerings will face some demand challenges.
Here at StockStory, we certainly understand the potential of thematic investing. Diverse winners from Microsoft (MSFT) to Alphabet (GOOG), Coca-Cola (KO) to Monster Beverage (MNST) could all have been identified as promising growth stories with a megatrend driving the growth. So, in that spirit, we’ve identified a relatively under-the-radar profitable growth stock benefiting from the rise of AI, available to you FREE via this link.
Key Takeaways from Jack in the Box’s Q1 Results
It was tough to see JACK's revenue and same-store sales fall slightly short of Wall Street’s estimates. On the bright side, its EPS and EBITDA beat. Still, this was a softer quarter. The stock remained flat at $25.70 immediately after reporting.
Is Jack in the Box an attractive investment opportunity right now? If you’re making that decision, you should consider the bigger picture of valuation, business qualities, as well as the latest earnings. We cover that in our actionable full research report which you can read here, it’s free.


