
Let’s dig into the relative performance of Procore (NYSE: PCOR) and its peers as we unravel the now-completed Q1 design software earnings season.
The demand for rich, interactive 2D, 3D, VR and AR experiences is growing, and while the ubiquitous metaverse might still be more of a buzzword than a real thing, what is real is the demand for the tools to create these experiences, whether they are games, 3D tours or interactive movies.
The 5 design software stocks we track reported a satisfactory Q1. As a group, revenues beat analysts’ consensus estimates by 2.6% while next quarter’s revenue guidance was in line.
In light of this news, share prices of the companies have held steady as they are up 4.9% on average since the latest earnings results.
Best Q1: Procore (NYSE: PCOR)
Used to manage the multi-year expansion of the Panama Canal that began in 2007, Procore (NYSE: PCOR) offers a software-as-service project, finance, and quality management platform for the construction industry.
Procore reported revenues of $310.6 million, up 15.3% year on year. This print exceeded analysts’ expectations by 2.6%. Overall, it was a strong quarter for the company with accelerating customer growth and a solid beat of analysts’ EBITDA estimates.
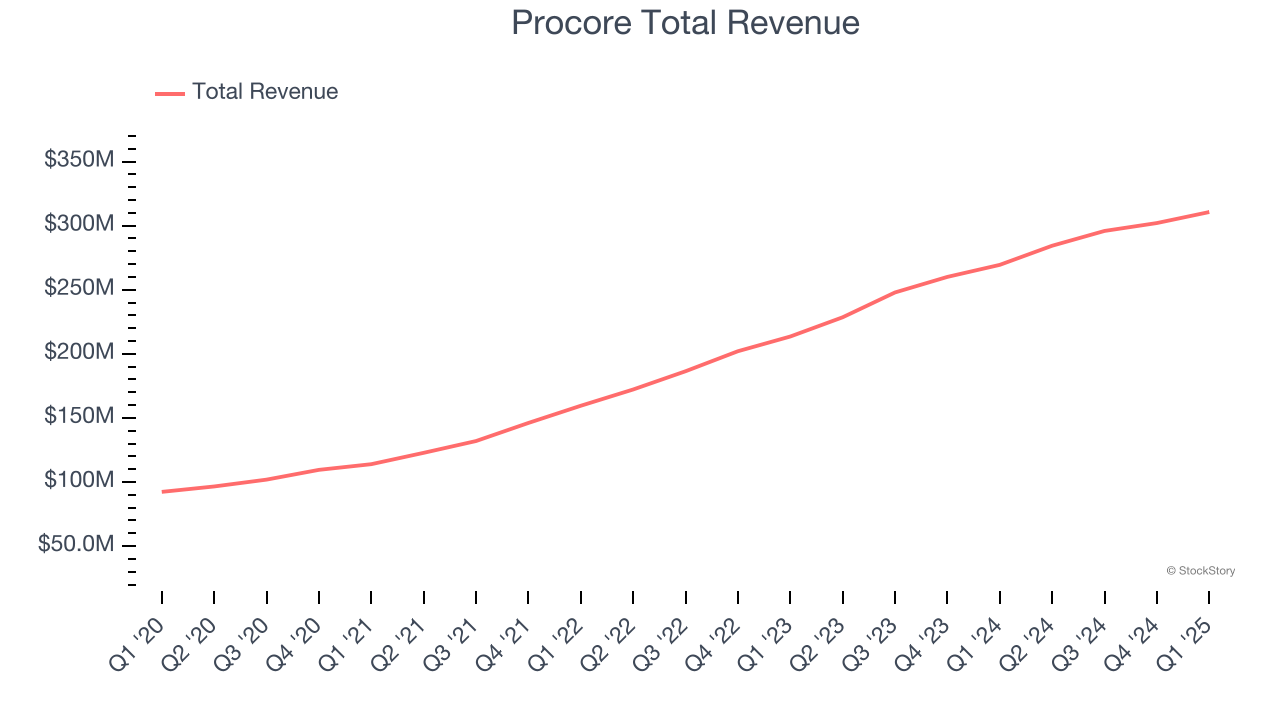
Interestingly, the stock is up 9.2% since reporting and currently trades at $69.
Is now the time to buy Procore? Access our full analysis of the earnings results here, it’s free.
Cadence (NASDAQ: CDNS)
With the name chosen to reflect the idea of a repeating pattern or rhythm in electronic design, Cadence Design Systems (NASDAQ: CDNS) offers a software-as-a-service platform for semiconductor engineering and design.
Cadence reported revenues of $1.24 billion, up 23.1% year on year, in line with analysts’ expectations. The business had a satisfactory quarter with a solid beat of analysts’ EBITDA estimates but a slight miss of analysts’ billings estimates.
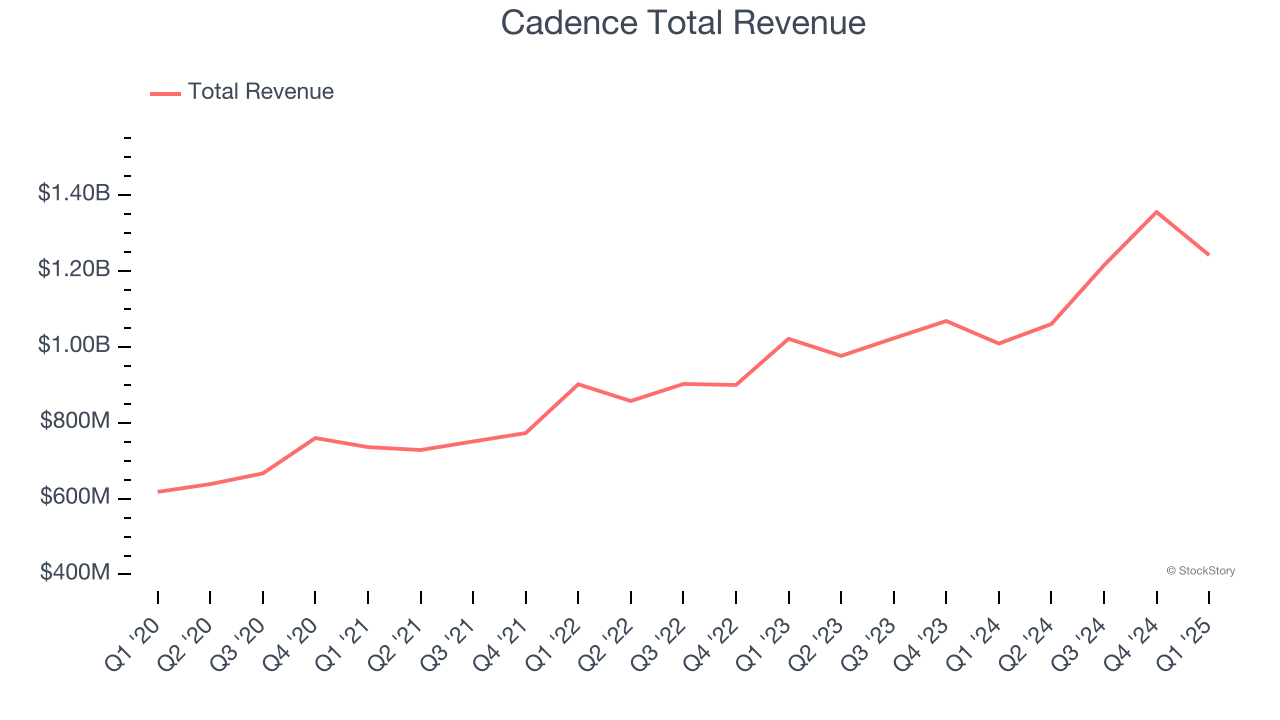
Cadence achieved the fastest revenue growth among its peers. The market seems happy with the results as the stock is up 11.5% since reporting. It currently trades at $318.50.
Is now the time to buy Cadence? Access our full analysis of the earnings results here, it’s free.
Weakest Q1: Adobe (NASDAQ: ADBE)
One of the most well-known Silicon Valley software companies around, Adobe (NASDAQ: ADBE) is a leading provider of software as service in the digital design and document management space.
Adobe reported revenues of $5.71 billion, up 10.3% year on year, exceeding analysts’ expectations by 1%. Still, it was a decent quarter as it posted EPS guidance for next quarter in line with analysts’ expectations.
Adobe delivered the weakest full-year guidance update in the group. As expected, the stock is down 9.4% since the results and currently trades at $397.67.
Read our full analysis of Adobe’s results here.
PTC (NASDAQ: PTC)
Used to design the Airbus A380 and Boeing 787 Dreamliner commercial airplanes, PTC’s (NASDAQ: PTC) software-as-service platform helps engineers and designers create and test products before manufacturing.
PTC reported revenues of $636.4 million, up 5.5% year on year. This number topped analysts’ expectations by 5%. More broadly, it was a mixed quarter as it also recorded an impressive beat of analysts’ EBITDA estimates but EPS guidance for next quarter missing analysts’ expectations.
PTC scored the biggest analyst estimates beat and highest full-year guidance raise among its peers. The stock is up 10.4% since reporting and currently trades at $170.96.
Read our full, actionable report on PTC here, it’s free.
Unity (NYSE: U)
Started as a game studio by three friends in a Copenhagen apartment, Unity (NYSE: U) is a software as a service platform that makes it easier to develop and monetize new games and other visual digital experiences.
Unity reported revenues of $435 million, down 5.5% year on year. This result beat analysts’ expectations by 4.4%. Taking a step back, it was a mixed quarter as it also produced an impressive beat of analysts’ billings estimates but revenue guidance for next quarter slightly missing analysts’ expectations.
Unity had the slowest revenue growth among its peers. The stock is up 3% since reporting and currently trades at $21.97.
Read our full, actionable report on Unity here, it’s free.
Market Update
Thanks to the Fed’s series of rate hikes in 2022 and 2023, inflation has cooled significantly from its post-pandemic highs, drawing closer to the 2% goal. This disinflation has occurred without severely impacting economic growth, suggesting the success of a soft landing. The stock market thrived in 2024, spurred by recent rate cuts (0.5% in September and 0.25% in November), and a notable surge followed Donald Trump’s presidential election win in November, propelling indices to historic highs. Nonetheless, the outlook for 2025 remains clouded by potential trade policy changes and corporate tax discussions, which could impact business confidence and growth. The path forward holds both optimism and caution as new policies take shape.
Want to invest in winners with rock-solid fundamentals? Check out our Hidden Gem Stocks and add them to your watchlist. These companies are poised for growth regardless of the political or macroeconomic climate.
Join Paid Stock Investor Research
Help us make StockStory more helpful to investors like yourself. Join our paid user research session and receive a $50 Amazon gift card for your opinions. Sign up here.


