
Over the past six months, Vertiv’s stock price fell to $105.35. Shareholders have lost 14.4% of their capital, disappointing when considering the S&P 500 was flat. This may have investors wondering how to approach the situation.
Following the drawdown, is now the time to buy VRT? Find out in our full research report, it’s free.
Why Are We Positive On Vertiv?
Formerly part of Emerson Electric, Vertiv (NYSE: VRT) manufactures and services infrastructure technology products for data centers and communication networks.
1. Core Business Firing on All Cylinders
In addition to reported revenue, organic revenue is a useful data point for analyzing Electrical Systems companies. This metric gives visibility into Vertiv’s core business because it excludes one-time events such as mergers, acquisitions, and divestitures along with foreign currency fluctuations - non-fundamental factors that can manipulate the income statement.
Over the last two years, Vertiv’s organic revenue averaged 18.5% year-on-year growth. This performance was fantastic and shows it can expand quickly without relying on expensive (and risky) acquisitions. 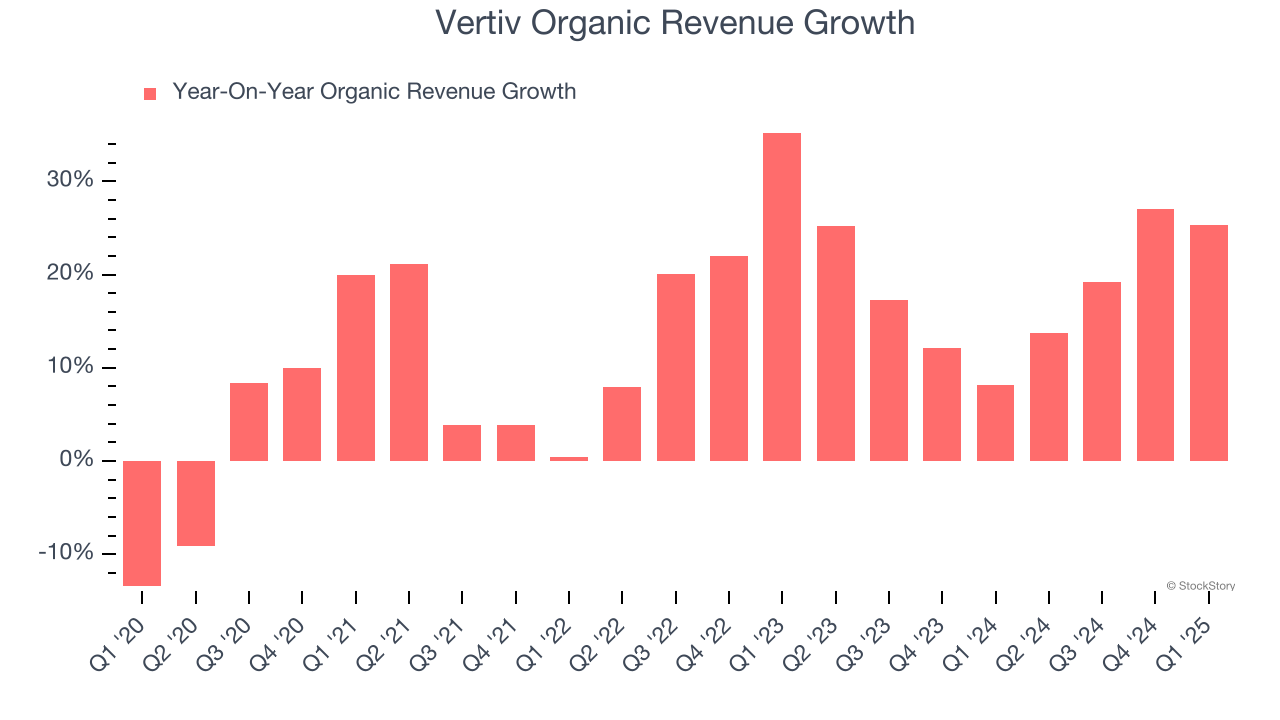
2. Increasing Free Cash Flow Margin Juices Financials
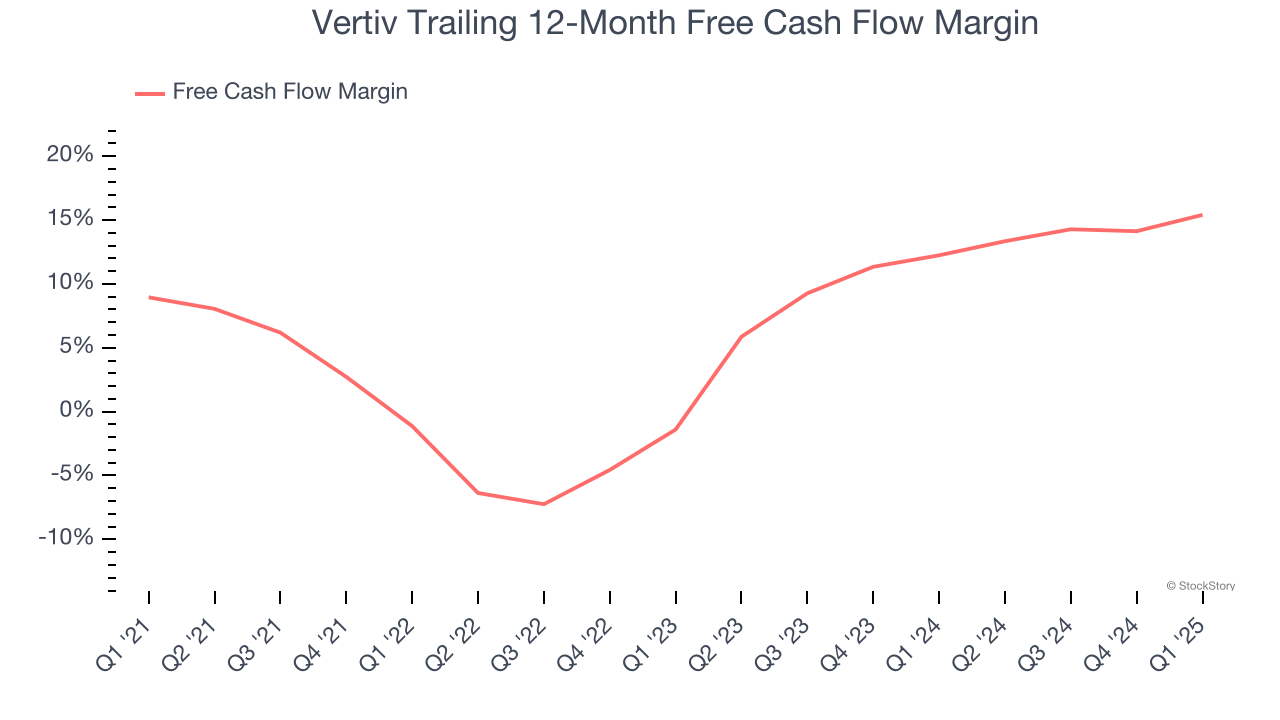
If you’ve followed StockStory for a while, you know we emphasize free cash flow. Why, you ask? We believe that in the end, cash is king, and you can’t use accounting profits to pay the bills.
As you can see below, Vertiv’s margin expanded by 6.5 percentage points over the last five years. This is encouraging because it gives the company more optionality. Vertiv’s free cash flow margin for the trailing 12 months was 15.4%.
3. New Investments Bear Fruit as ROIC Jumps
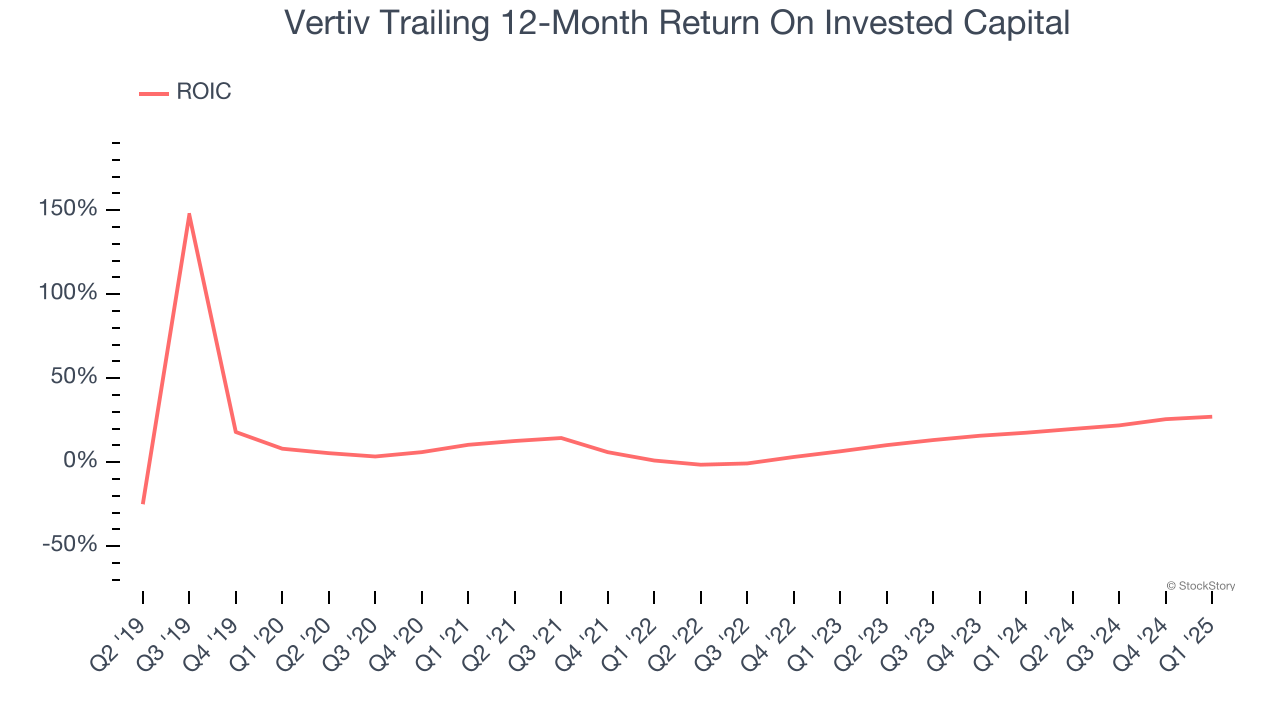
A company’s ROIC, or return on invested capital, shows how much operating profit it makes compared to the money it has raised (debt and equity).
We like to invest in businesses with high returns, but the trend in a company’s ROIC is what often surprises the market and moves the stock price. Fortunately, Vertiv’s ROIC has increased significantly over the last few years. This is a great sign when paired with its already strong returns. It could suggest its competitive advantage or profitable growth opportunities are expanding.
Final Judgment
These are just a few reasons why we think Vertiv is one of the best industrials companies out there. After the recent drawdown, the stock trades at 28.3× forward P/E (or $105.35 per share). Is now the right time to buy? See for yourself in our comprehensive research report, it’s free.
Stocks We Like Even More Than Vertiv
The market surged in 2024 and reached record highs after Donald Trump’s presidential victory in November, but questions about new economic policies are adding much uncertainty for 2025.
While the crowd speculates what might happen next, we’re homing in on the companies that can succeed regardless of the political or macroeconomic environment. Put yourself in the driver’s seat and build a durable portfolio by checking out our Top 5 Strong Momentum Stocks for this week. This is a curated list of our High Quality stocks that have generated a market-beating return of 176% over the last five years.
Stocks that made our list in 2020 include now familiar names such as Nvidia (+1,545% between March 2020 and March 2025) as well as under-the-radar businesses like the once-micro-cap company Kadant (+351% five-year return). Find your next big winner with StockStory today.


