
Over the last six months, Genesco’s shares have sunk to $23.09, producing a disappointing 20% loss while the S&P 500 was flat. This was partly driven by its softer quarterly results and might have investors contemplating their next move.
Is now the time to buy Genesco, or should you be careful about including it in your portfolio? Get the full stock story straight from our expert analysts, it’s free.
Why Do We Think Genesco Will Underperform?
Even though the stock has become cheaper, we're cautious about Genesco. Here are three reasons why you should be careful with GCO and a stock we'd rather own.
1. Flat Same-Store Sales Indicate Weak Demand
We can better understand Footwear companies by analyzing their same-store sales. This metric measures the change in sales at brick-and-mortar locations that have existed for at least a year, giving visibility into Genesco’s underlying demand characteristics.
Over the last two years, Genesco failed to grow its same-store sales. This performance was underwhelming and implies there may be increasing competition or market saturation. It also suggests Genesco might have to change its strategy and pricing, which can disrupt operations. 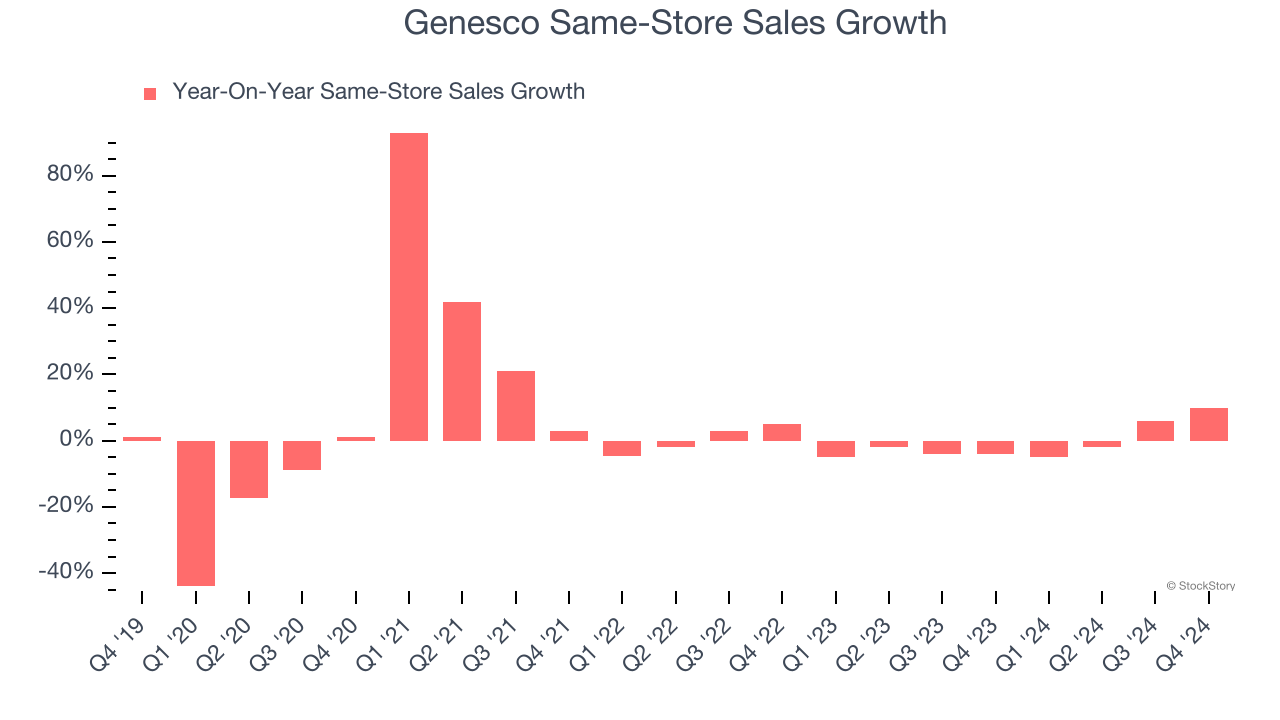
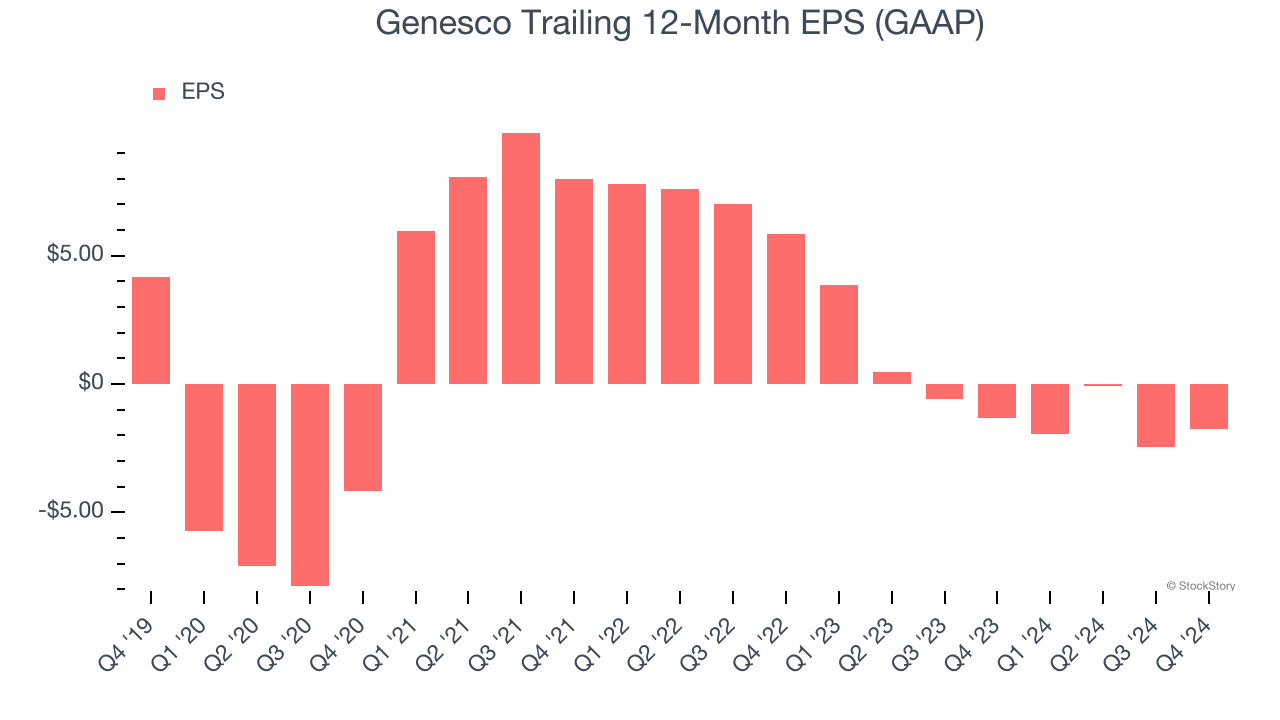
2. EPS Trending Down
We track the long-term change in earnings per share (EPS) because it highlights whether a company’s growth is profitable.
Sadly for Genesco, its EPS declined by 19.4% annually over the last five years while its revenue grew by 1.1%. This tells us the company became less profitable on a per-share basis as it expanded.
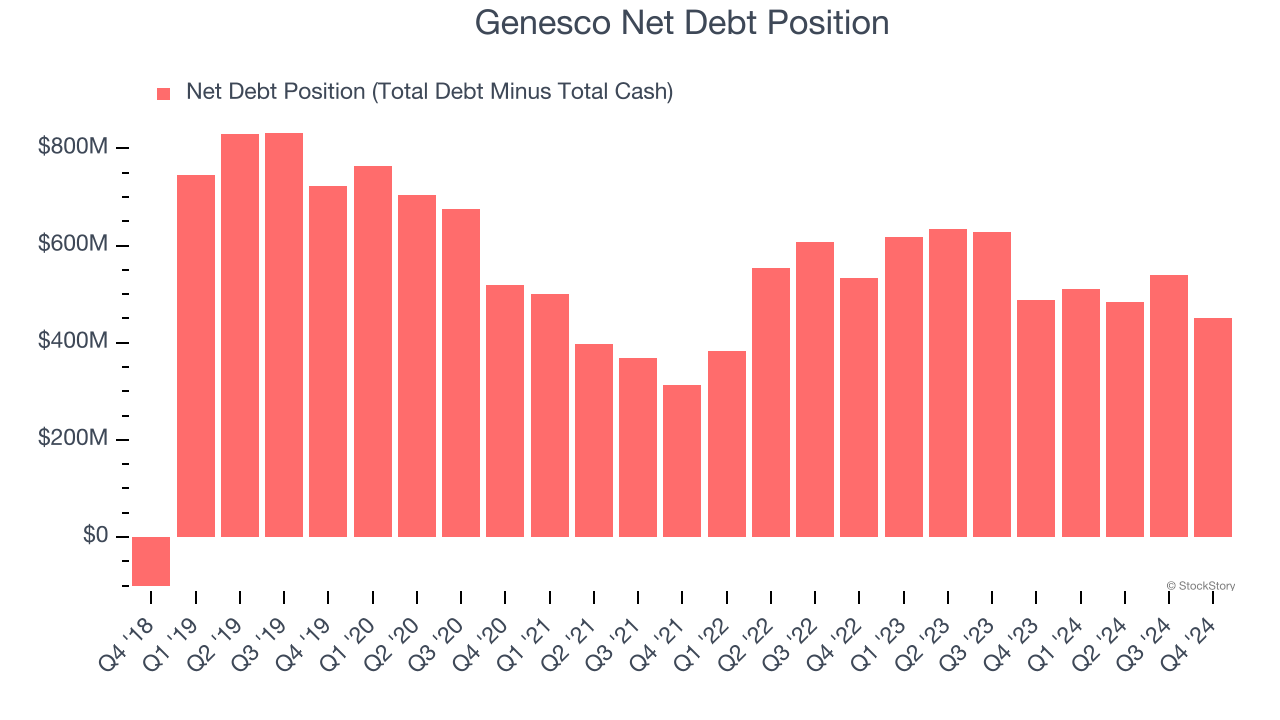
3. High Debt Levels Increase Risk
As long-term investors, the risk we care about most is the permanent loss of capital, which can happen when a company goes bankrupt or raises money from a disadvantaged position. This is separate from short-term stock price volatility, something we are much less bothered by.
Genesco’s $485.1 million of debt exceeds the $34.01 million of cash on its balance sheet. Furthermore, its 6× net-debt-to-EBITDA ratio (based on its EBITDA of $71.37 million over the last 12 months) shows the company is overleveraged.
At this level of debt, incremental borrowing becomes increasingly expensive and credit agencies could downgrade the company’s rating if profitability falls. Genesco could also be backed into a corner if the market turns unexpectedly – a situation we seek to avoid as investors in high-quality companies.
We hope Genesco can improve its balance sheet and remain cautious until it increases its profitability or pays down its debt.
Final Judgment
We see the value of companies helping consumers, but in the case of Genesco, we’re out. Following the recent decline, the stock trades at $23.09 per share (or a forward price-to-sales ratio of 0.1×). The market typically values companies like Genesco based on their anticipated profits for the next 12 months, but there aren’t enough published estimates to arrive at a reliable number. You should avoid this stock for now - better opportunities lie elsewhere. Let us point you toward our favorite semiconductor picks and shovels play.
Stocks We Like More Than Genesco
The market surged in 2024 and reached record highs after Donald Trump’s presidential victory in November, but questions about new economic policies are adding much uncertainty for 2025.
While the crowd speculates what might happen next, we’re homing in on the companies that can succeed regardless of the political or macroeconomic environment. Put yourself in the driver’s seat and build a durable portfolio by checking out our Top 9 Market-Beating Stocks. This is a curated list of our High Quality stocks that have generated a market-beating return of 176% over the last five years.
Stocks that made our list in 2020 include now familiar names such as Nvidia (+1,545% between March 2020 and March 2025) as well as under-the-radar businesses like the once-micro-cap company Tecnoglass (+1,754% five-year return). Find your next big winner with StockStory today.


