HEICO currently trades at $281.91 per share and has shown little upside over the past six months, posting a middling return of 1.6%.
Is now the time to buy HEI? Find out in our full research report, it’s free.
Why Is HEI a Good Business?
Founded in 1957, HEICO (NYSE: HEI) manufactures and services aerospace and electronic components for commercial aviation, defense, space, and other industries.
1. Organic Growth Indicates Solid Core Business
Investors interested in Aerospace companies should track organic revenue in addition to reported revenue. This metric gives visibility into HEICO’s core business because it excludes one-time events such as mergers, acquisitions, and divestitures along with foreign currency fluctuations - non-fundamental factors that can manipulate the income statement.
Over the last two years, HEICO’s organic revenue averaged 9.6% year-on-year growth. This performance was solid and shows it can expand steadily without relying on expensive (and risky) acquisitions. 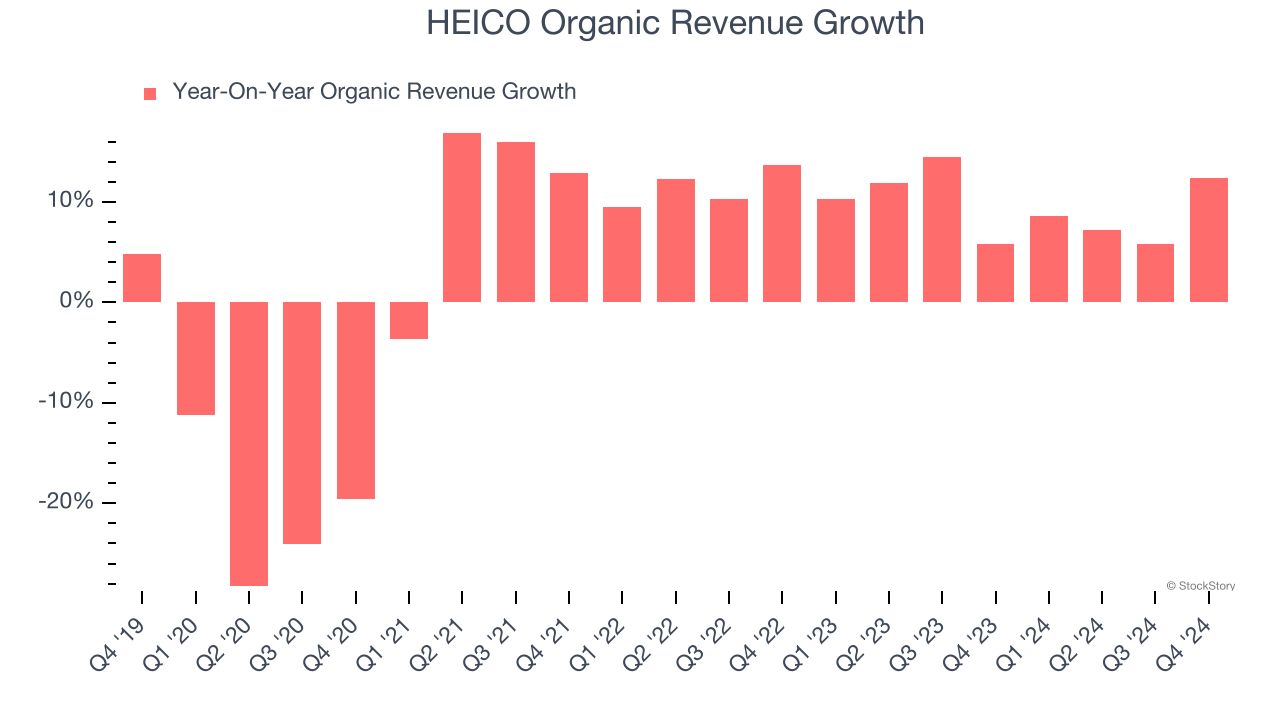
2. EPS Moving Up Steadily
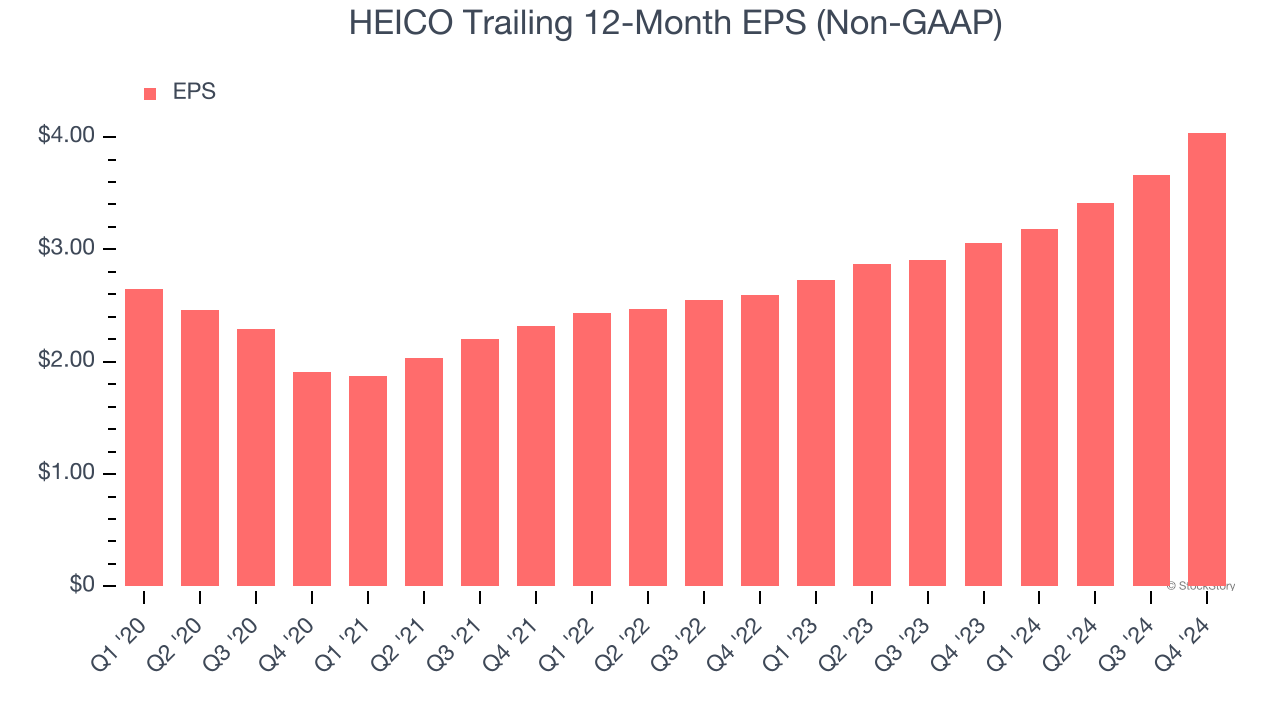
We track the long-term change in earnings per share (EPS) because it highlights whether a company’s growth is profitable.
HEICO’s EPS grew at a decent 8.5% compounded annual growth rate over the last five years. This performance was better than most industrials businesses.
3. Excellent Free Cash Flow Margin Boosts Reinvestment Potential
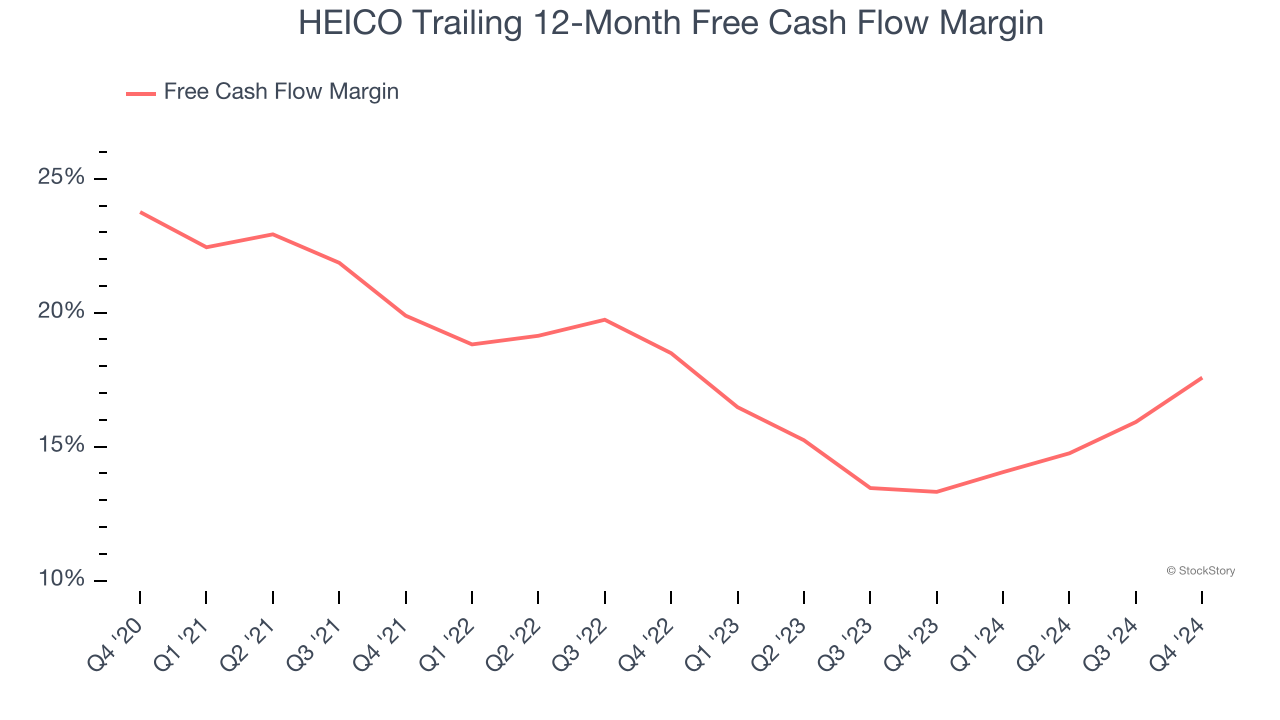
Free cash flow isn't a prominently featured metric in company financials and earnings releases, but we think it's telling because it accounts for all operating and capital expenses, making it tough to manipulate. Cash is king.
HEICO has shown terrific cash profitability, putting it in an advantageous position to invest in new products, return capital to investors, and consolidate the market during industry downturns. The company’s free cash flow margin was among the best in the industrials sector, averaging 17.8% over the last five years.
Final Judgment
These are just a few reasons why we think HEICO is a great business, but at $281.91 per share (or 63.7× forward P/E), is now the right time to buy the stock? See for yourself in our full research report, it’s free.
High-Quality Stocks for All Market Conditions
Donald Trump’s victory in the 2024 U.S. Presidential Election sent major indices to all-time highs, but stocks have retraced as investors debate the health of the economy and the potential impact of tariffs.
While this leaves much uncertainty around 2025, a few companies are poised for long-term gains regardless of the political or macroeconomic climate, like our Top 9 Market-Beating Stocks. This is a curated list of our High Quality stocks that have generated a market-beating return of 176% over the last five years.
Stocks that made our list in 2020 include now familiar names such as Nvidia (+1,545% between March 2020 and March 2025) as well as under-the-radar businesses like the once-small-cap company Comfort Systems (+782% five-year return). Find your next big winner with StockStory today.