Since November 2024, Mayville Engineering has been in a holding pattern, posting a small loss of 4.2% while floating around $15.86.
Is there a buying opportunity in Mayville Engineering, or does it present a risk to your portfolio? See what our analysts have to say in our full research report, it’s free.
Why Do We Think Mayville Engineering Will Underperform?
We're swiping left on Mayville Engineering for now. Here are three reasons why MEC doesn't excite us and a stock we'd rather own.
1. Long-Term Revenue Growth Disappoints
Reviewing a company’s long-term sales performance reveals insights into its quality. Even a bad business can shine for one or two quarters, but a top-tier one grows for years. Regrettably, Mayville Engineering’s sales grew at a sluggish 2.8% compounded annual growth rate over the last five years. This fell short of our benchmarks. 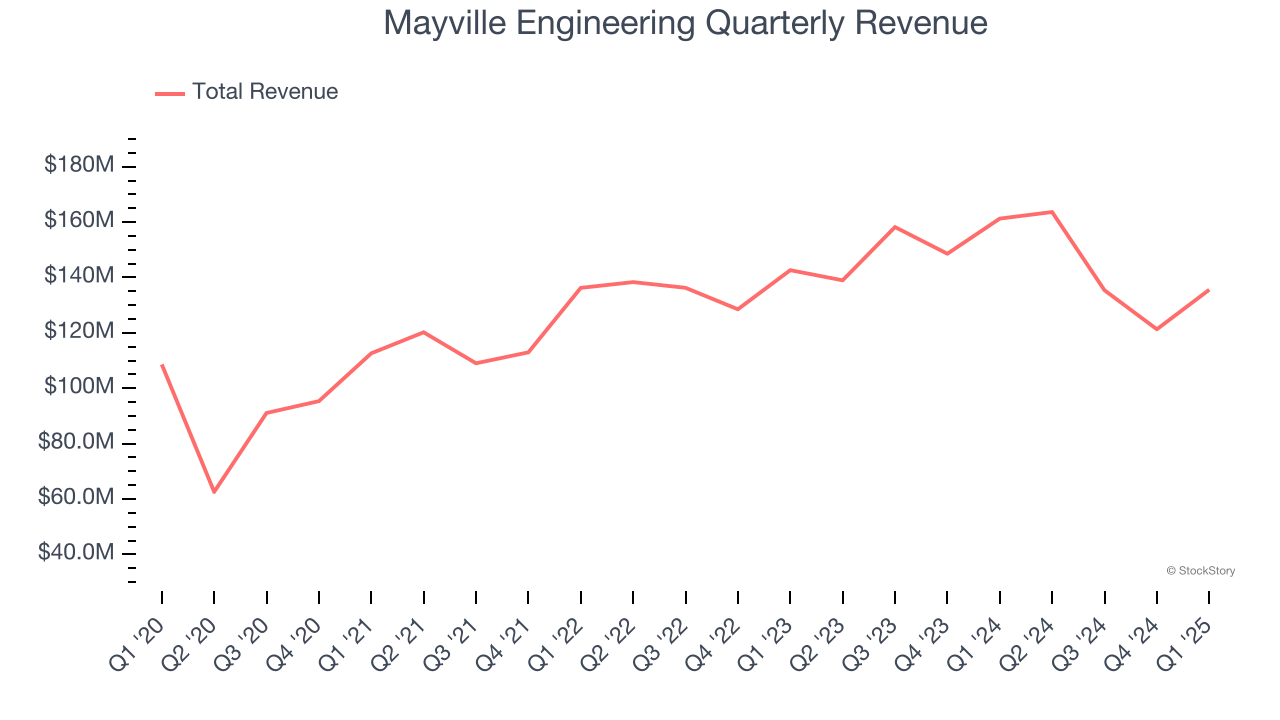
2. Low Gross Margin Reveals Weak Structural Profitability
Gross profit margin is a critical metric to track because it sheds light on its pricing power, complexity of products, and ability to procure raw materials, equipment, and labor.
Mayville Engineering has bad unit economics for an industrials business, signaling it operates in a competitive market. As you can see below, it averaged a 12.5% gross margin over the last five years. That means Mayville Engineering paid its suppliers a lot of money ($87.45 for every $100 in revenue) to run its business. 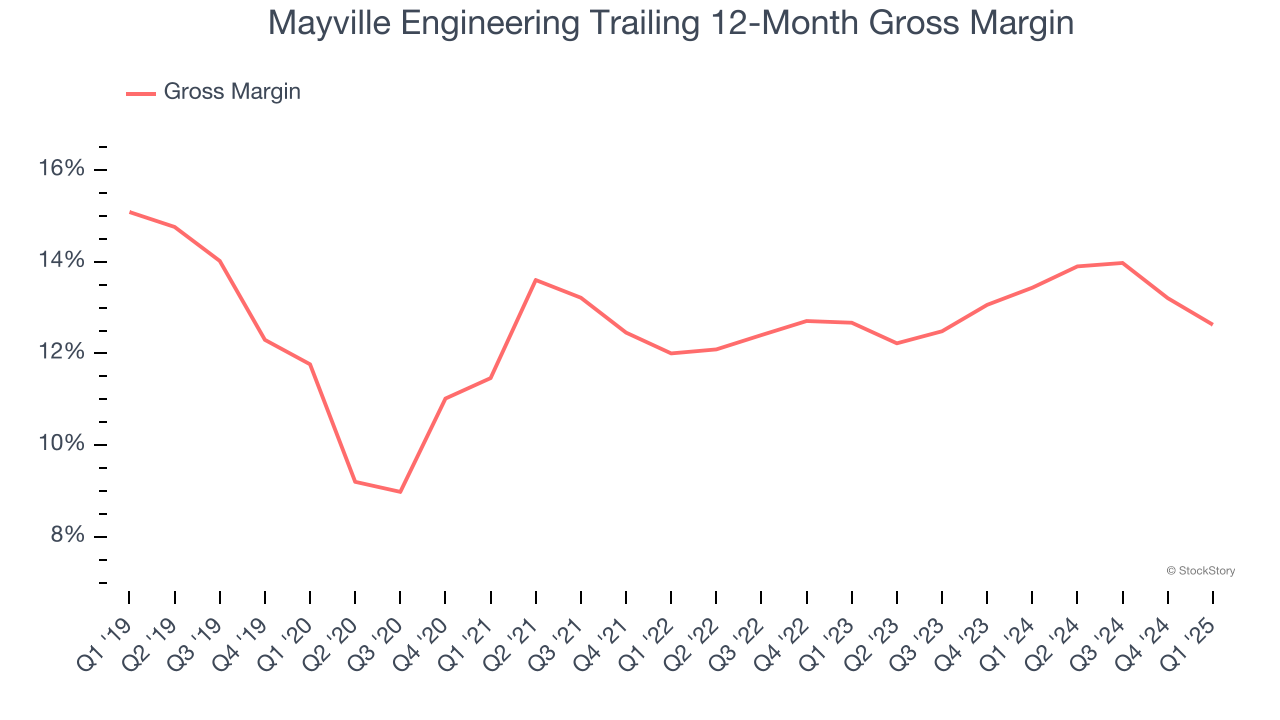
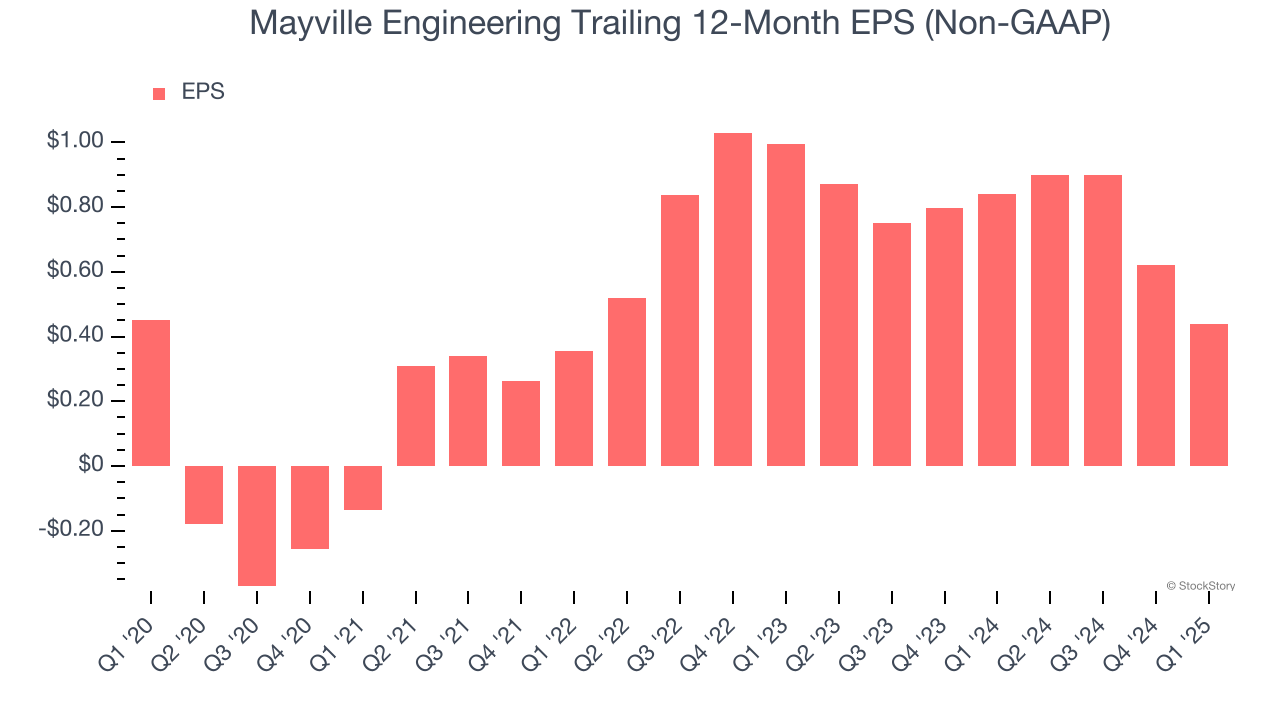
3. EPS Growth Has Stalled
We track the long-term change in earnings per share (EPS) because it highlights whether a company’s growth is profitable.
Mayville Engineering’s flat EPS over the last five years was below its 2.8% annualized revenue growth. This tells us the company became less profitable on a per-share basis as it expanded.
Final Judgment
Mayville Engineering falls short of our quality standards. That said, the stock currently trades at 5× forward EV-to-EBITDA (or $15.86 per share). While this valuation is fair, the upside isn’t great compared to the potential downside. There are more exciting stocks to buy at the moment. We’d recommend looking at a fast-growing restaurant franchise with an A+ ranch dressing sauce.
Stocks We Would Buy Instead of Mayville Engineering
The market surged in 2024 and reached record highs after Donald Trump’s presidential victory in November, but questions about new economic policies are adding much uncertainty for 2025.
While the crowd speculates what might happen next, we’re homing in on the companies that can succeed regardless of the political or macroeconomic environment. Put yourself in the driver’s seat and build a durable portfolio by checking out our Top 9 Market-Beating Stocks. This is a curated list of our High Quality stocks that have generated a market-beating return of 176% over the last five years.
Stocks that made our list in 2020 include now familiar names such as Nvidia (+1,545% between March 2020 and March 2025) as well as under-the-radar businesses like the once-small-cap company Comfort Systems (+782% five-year return). Find your next big winner with StockStory today.