Semiconductor company Semtech (NASDAQ: SMTC) met Wall Street’s revenue expectations in Q1 CY2025, with sales up 21.8% year on year to $251.1 million. On the other hand, next quarter’s revenue guidance of $256 million was less impressive, coming in 1.7% below analysts’ estimates. Its non-GAAP profit of $0.38 per share was in line with analysts’ consensus estimates.
Is now the time to buy Semtech? Find out by accessing our full research report, it’s free.
Semtech (SMTC) Q1 CY2025 Highlights:
- Revenue: $251.1 million vs analyst estimates of $251 million (21.8% year-on-year growth, in line)
- Adjusted EPS: $0.38 vs analyst estimates of $0.37 (in line)
- Adjusted EBITDA: $55.4 million vs analyst estimates of $47.72 million (22.1% margin, 16.1% beat)
- Revenue Guidance for Q2 CY2025 is $256 million at the midpoint, below analyst estimates of $260.4 million
- Adjusted EPS guidance for Q2 CY2025 is $0.40 at the midpoint
- EBITDA guidance for Q2 CY2025 is $56 million at the midpoint, above analyst estimates of $49.2 million
- Operating Margin: 14.3%, up from 1.5% in the same quarter last year
- Free Cash Flow was $26.2 million, up from -$1.42 million in the same quarter last year
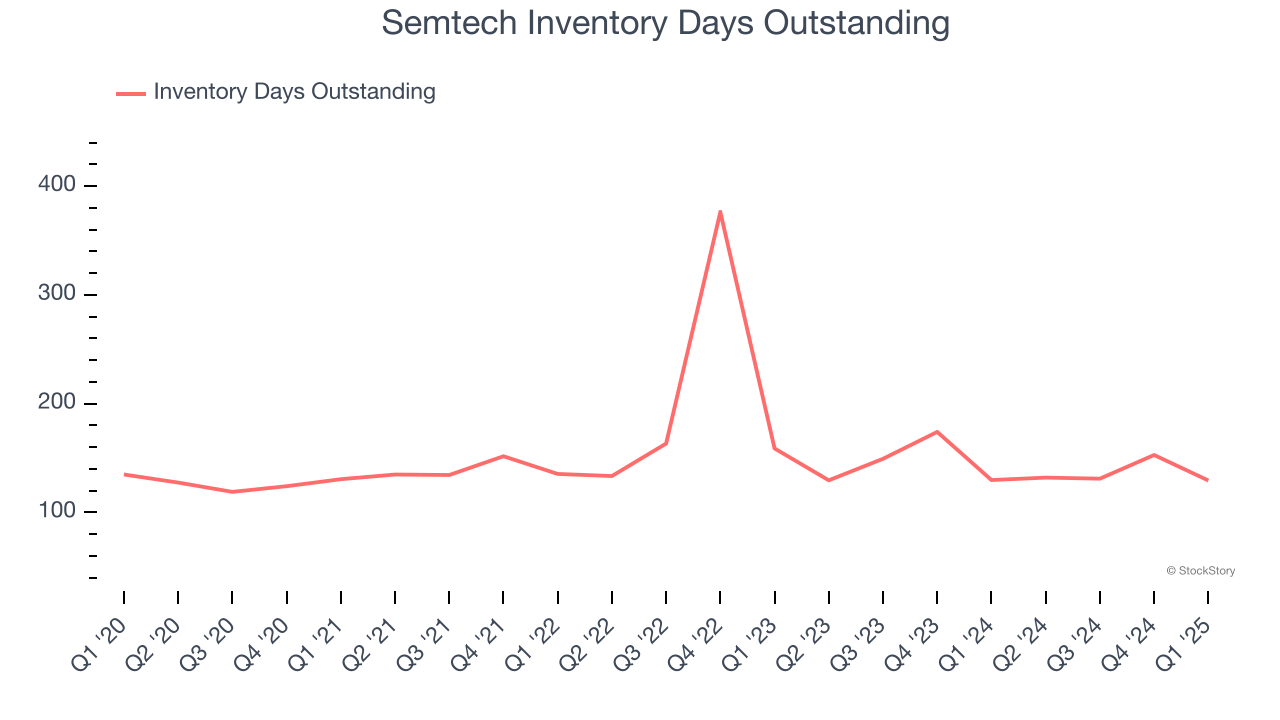
- Inventory Days Outstanding: 129, down from 153 in the previous quarter
- Market Capitalization: $3.23 billion
Company Overview
A public company since the late 1960s, Semtech (NASDAQ: SMTC) is a provider of analog and mixed-signal semiconductors used for Internet of Things systems and cloud connectivity.
Sales Growth
A company’s long-term performance is an indicator of its overall quality. Any business can have short-term success, but a top-tier one grows for years. Over the last five years, Semtech grew its sales at a solid 11.7% compounded annual growth rate. Its growth beat the average semiconductor company and shows its offerings resonate with customers. Semiconductors are a cyclical industry, and long-term investors should be prepared for periods of high growth followed by periods of revenue contractions.
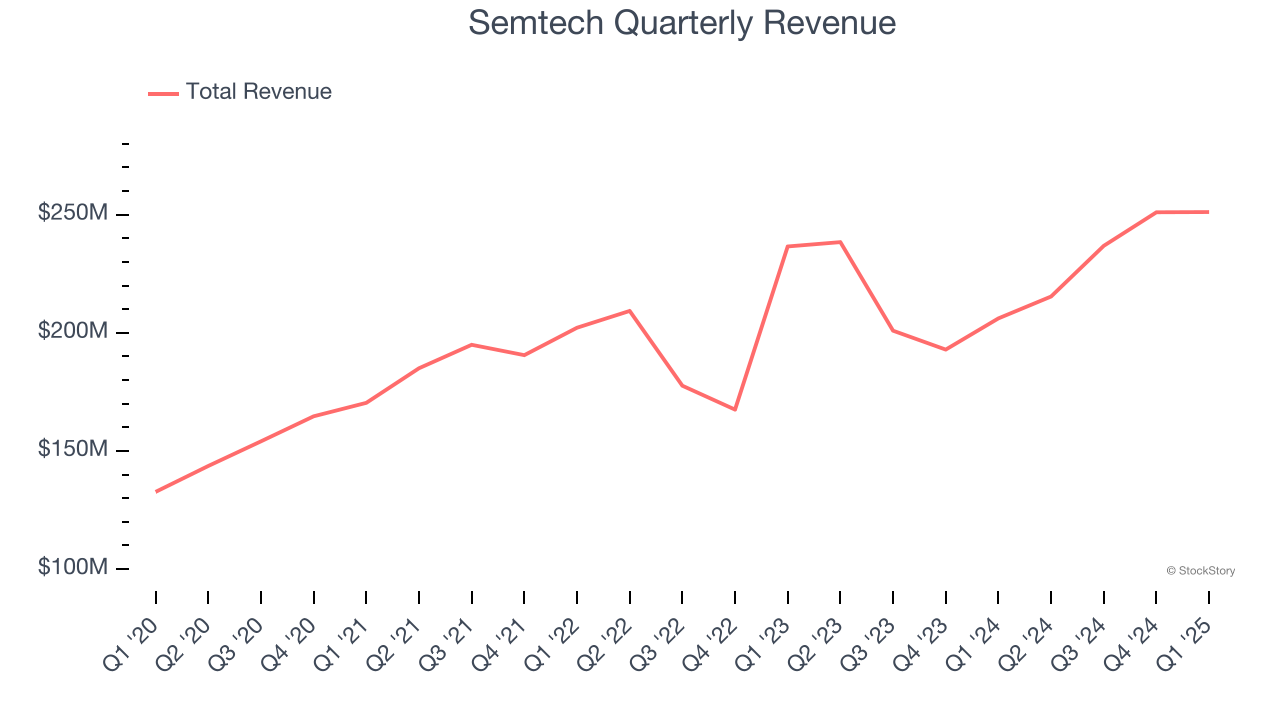
We at StockStory place the most emphasis on long-term growth, but within semiconductors, a half-decade historical view may miss new demand cycles or industry trends like AI. Semtech’s annualized revenue growth of 9.8% over the last two years is below its five-year trend, but we still think the results suggest healthy demand. 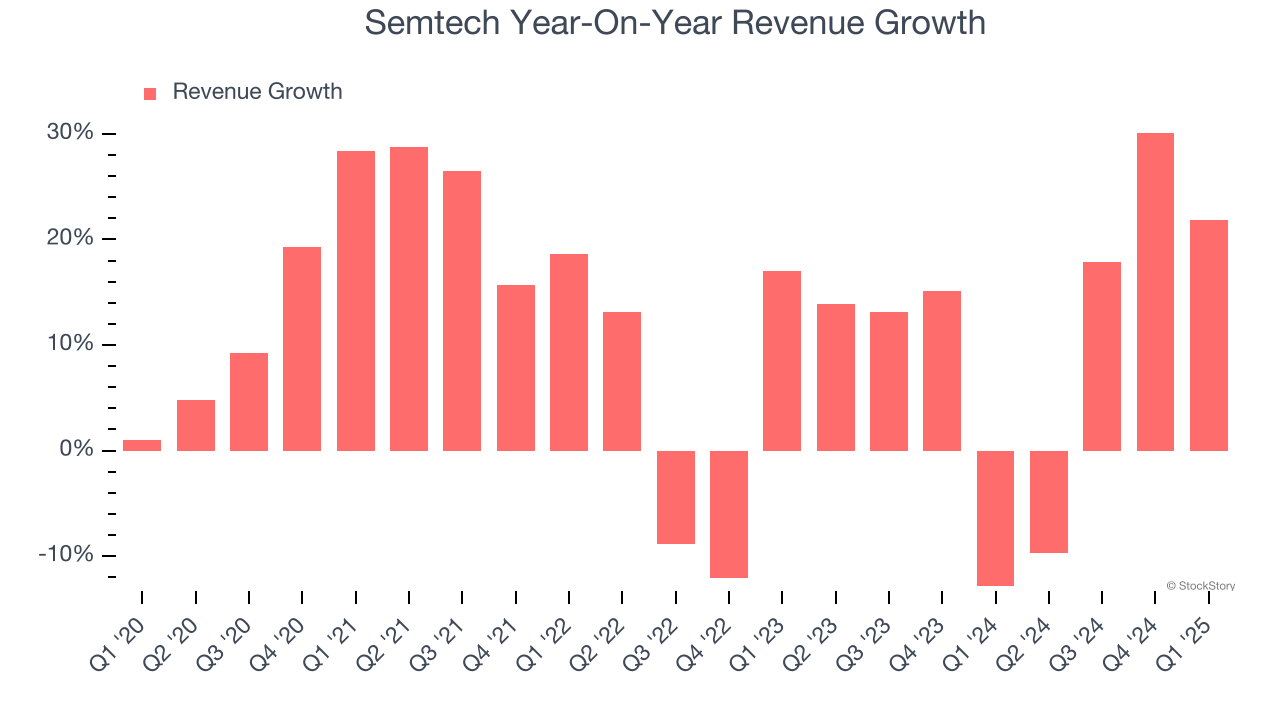
This quarter, Semtech’s year-on-year revenue growth of 21.8% was excellent, and its $251.1 million of revenue was in line with Wall Street’s estimates. Beyond meeting estimates, we believe the company is still in the early days of an upcycle as this was the third consecutive quarter of growth - a typical upcycle tends to last 8-10 quarters. Company management is currently guiding for a 18.9% year-on-year increase in sales next quarter.
Looking further ahead, sell-side analysts expect revenue to decline by 1.4% over the next 12 months, a deceleration versus the last two years. This projection is underwhelming and indicates its products and services will face some demand challenges.
Here at StockStory, we certainly understand the potential of thematic investing. Diverse winners from Microsoft (MSFT) to Alphabet (GOOG), Coca-Cola (KO) to Monster Beverage (MNST) could all have been identified as promising growth stories with a megatrend driving the growth. So, in that spirit, we’ve identified a relatively under-the-radar profitable growth stock benefiting from the rise of AI, available to you FREE via this link.
Product Demand & Outstanding Inventory
Days Inventory Outstanding (DIO) is an important metric for chipmakers, as it reflects a business’ capital intensity and the cyclical nature of semiconductor supply and demand. In a tight supply environment, inventories tend to be stable, allowing chipmakers to exert pricing power. Steadily increasing DIO can be a warning sign that demand is weak, and if inventories continue to rise, the company may have to downsize production.
This quarter, Semtech’s DIO came in at 129, which is 21 days below its five-year average. At the moment, these numbers show no indication of an excessive inventory buildup.
Key Takeaways from Semtech’s Q1 Results
We were impressed by Semtech’s strong improvement in inventory levels. We were also glad its adjusted operating income outperformed Wall Street’s estimates. On the other hand, revenue was just in line this quarter, and revenue guidance for next quarter missed. Overall, this print was mixed. The stock traded down 3.5% to $37.45 immediately after reporting.
Should you buy the stock or not? When making that decision, it’s important to consider its valuation, business qualities, as well as what has happened in the latest quarter. We cover that in our actionable full research report which you can read here, it’s free.


