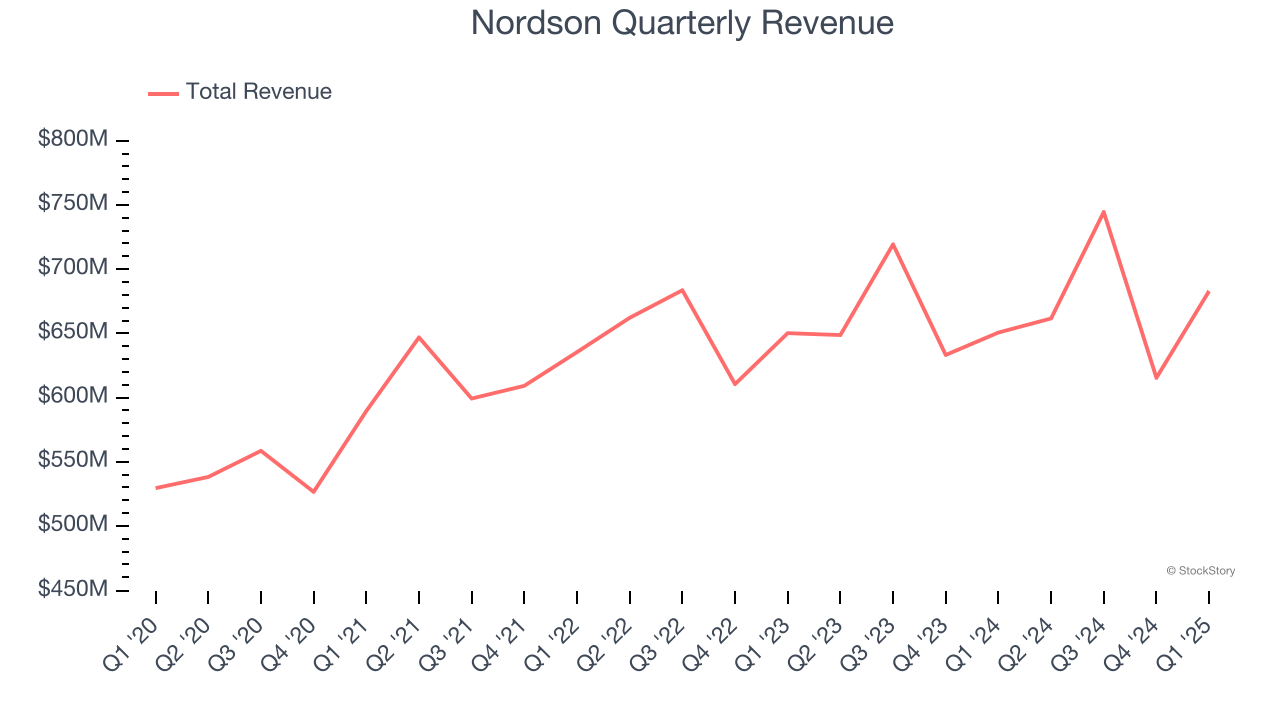
Manufacturing company Nordson (NASDAQ: NDSN) reported Q1 CY2025 results beating Wall Street’s revenue expectations, with sales up 5% year on year to $682.9 million. Guidance for next quarter’s revenue was optimistic at $730 million at the midpoint, 2.3% above analysts’ estimates. Its non-GAAP profit of $2.42 per share was 2.6% above analysts’ consensus estimates.
Is now the time to buy Nordson? Find out by accessing our full research report, it’s free.
Nordson (NDSN) Q1 CY2025 Highlights:
- Revenue: $682.9 million vs analyst estimates of $675.7 million (5% year-on-year growth, 1.1% beat)
- Adjusted EPS: $2.42 vs analyst estimates of $2.36 (2.6% beat)
- Adjusted EBITDA: $217.2 million vs analyst estimates of $214 million (31.8% margin, 1.5% beat)
- Revenue Guidance for Q2 CY2025 is $730 million at the midpoint, above analyst estimates of $713.5 million
- Adjusted EPS guidance for Q2 CY2025 is $2.65 at the midpoint
- Operating Margin: 24.7%, down from 25.9% in the same quarter last year
- Free Cash Flow Margin: 15.1%, down from 16.6% in the same quarter last year
- Organic Revenue fell 2.4% year on year (-3.7% in the same quarter last year)
- Market Capitalization: $11.27 billion
Commenting on the Company’s fiscal 2025 second quarter results, Nordson President and Chief Executive Officer Sundaram Nagarajan said, “We started the second quarter with increasing momentum in order entry, and our results outperformed the mid-point of our sales and earnings guidance. This was driven by strength in our electronics systems sales and steady growth in nonwovens systems, precision agriculture and medical fluid components. Also, our Atrion acquisition continues to perform above expectations. As expected, this growth was partially offset by year-over-year weakness in industrial systems sales, which improved sequentially compared to the first quarter. Operational excellence drove strong profit performance of 32% EBITDA despite the uncertain geopolitical environment. We also maintained our sound balance sheet and bought back $85 million in shares during this dynamic quarter.”
Company Overview
Founded in 1954, Nordson Corporation (NASDAQ: NDSN) manufactures dispensing equipment and industrial adhesives, sealants and coatings.
Sales Growth
A company’s long-term sales performance can indicate its overall quality. Any business can put up a good quarter or two, but the best consistently grow over the long haul. Unfortunately, Nordson’s 4.5% annualized revenue growth over the last five years was tepid. This fell short of our benchmark for the industrials sector and is a poor baseline for our analysis.
Long-term growth is the most important, but within industrials, a half-decade historical view may miss new industry trends or demand cycles. Nordson’s recent performance shows its demand has slowed as its annualized revenue growth of 1.9% over the last two years was below its five-year trend. 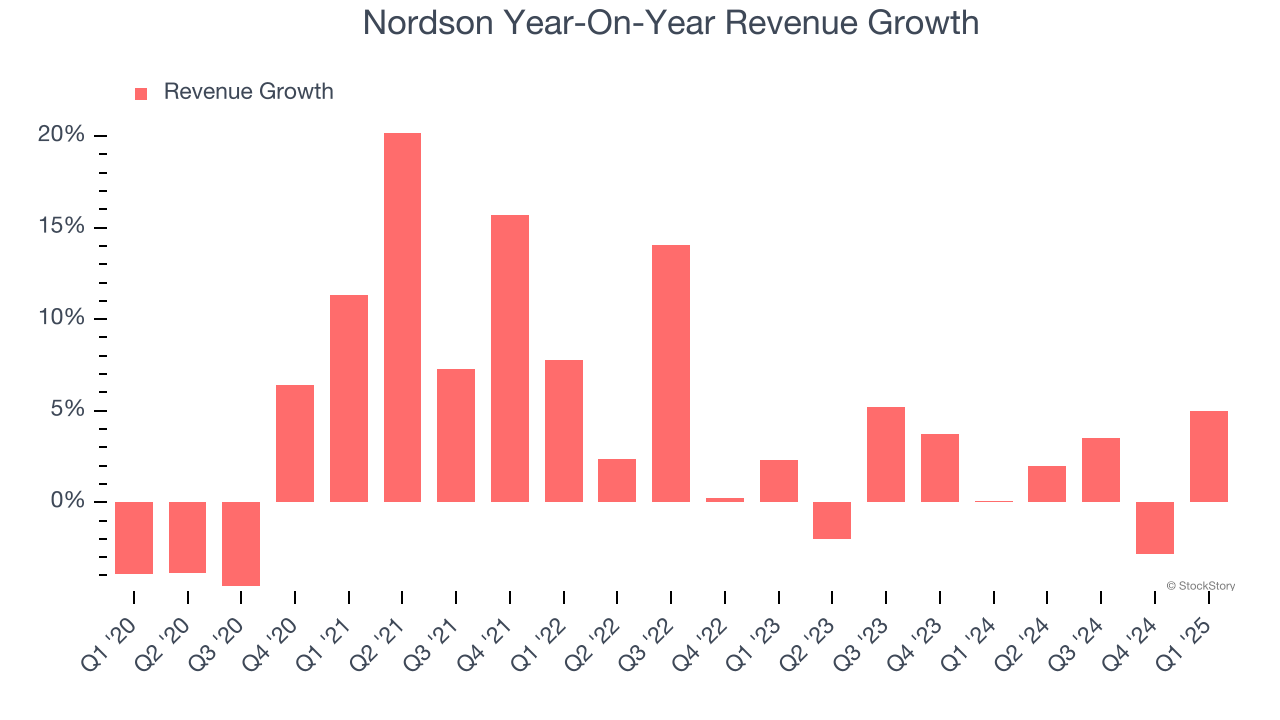
Nordson also reports organic revenue, which strips out one-time events like acquisitions and currency fluctuations that don’t accurately reflect its fundamentals. Over the last two years, Nordson’s organic revenue averaged 3.7% year-on-year declines. Because this number is lower than its normal revenue growth, we can see that some mixture of acquisitions and foreign exchange rates boosted its headline results. 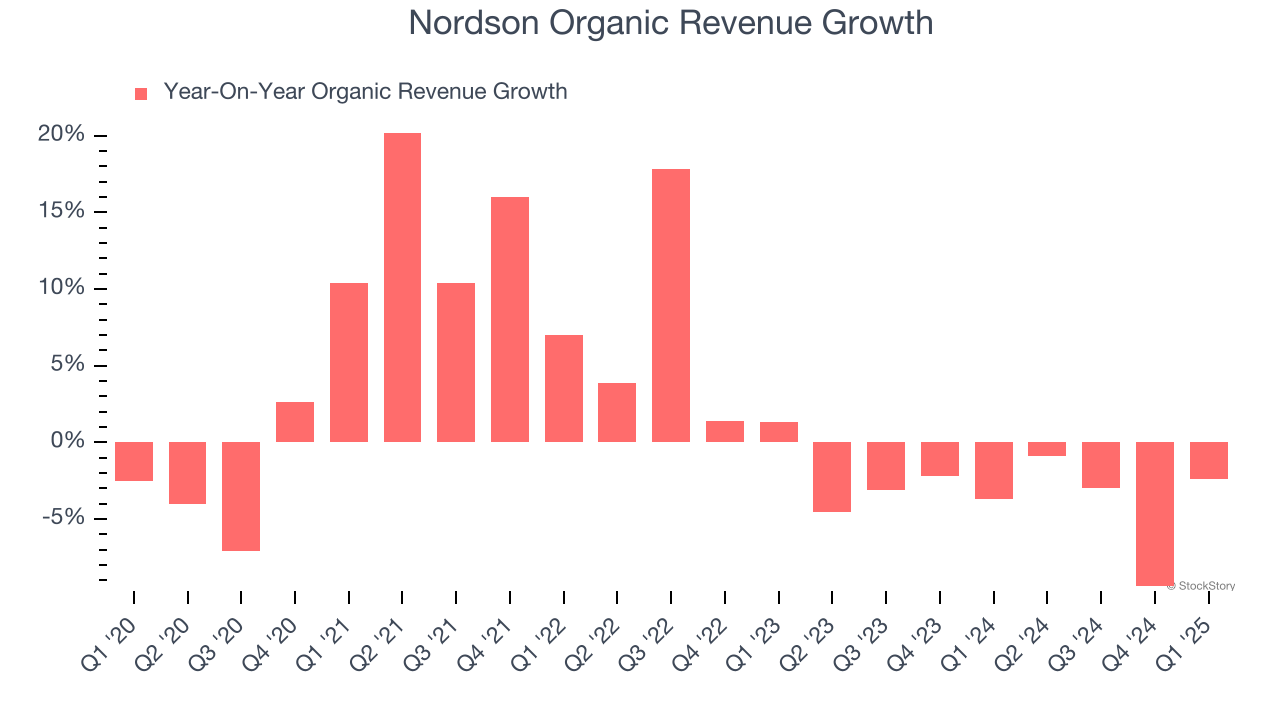
This quarter, Nordson reported modest year-on-year revenue growth of 5% but beat Wall Street’s estimates by 1.1%. Company management is currently guiding for a 10.3% year-on-year increase in sales next quarter.
Looking further ahead, sell-side analysts expect revenue to grow 5.6% over the next 12 months. Although this projection indicates its newer products and services will spur better top-line performance, it is still below average for the sector.
Software is eating the world and there is virtually no industry left that has been untouched by it. That drives increasing demand for tools helping software developers do their jobs, whether it be monitoring critical cloud infrastructure, integrating audio and video functionality, or ensuring smooth content streaming. Click here to access a free report on our 3 favorite stocks to play this generational megatrend.
Operating Margin
Operating margin is an important measure of profitability as it shows the portion of revenue left after accounting for all core expenses – everything from the cost of goods sold to advertising and wages. It’s also useful for comparing profitability across companies with different levels of debt and tax rates because it excludes interest and taxes.
Nordson has been a well-oiled machine over the last five years. It demonstrated elite profitability for an industrials business, boasting an average operating margin of 24.7%. This result isn’t surprising as its high gross margin gives it a favorable starting point.
Analyzing the trend in its profitability, Nordson’s operating margin rose by 5 percentage points over the last five years, as its sales growth gave it operating leverage.
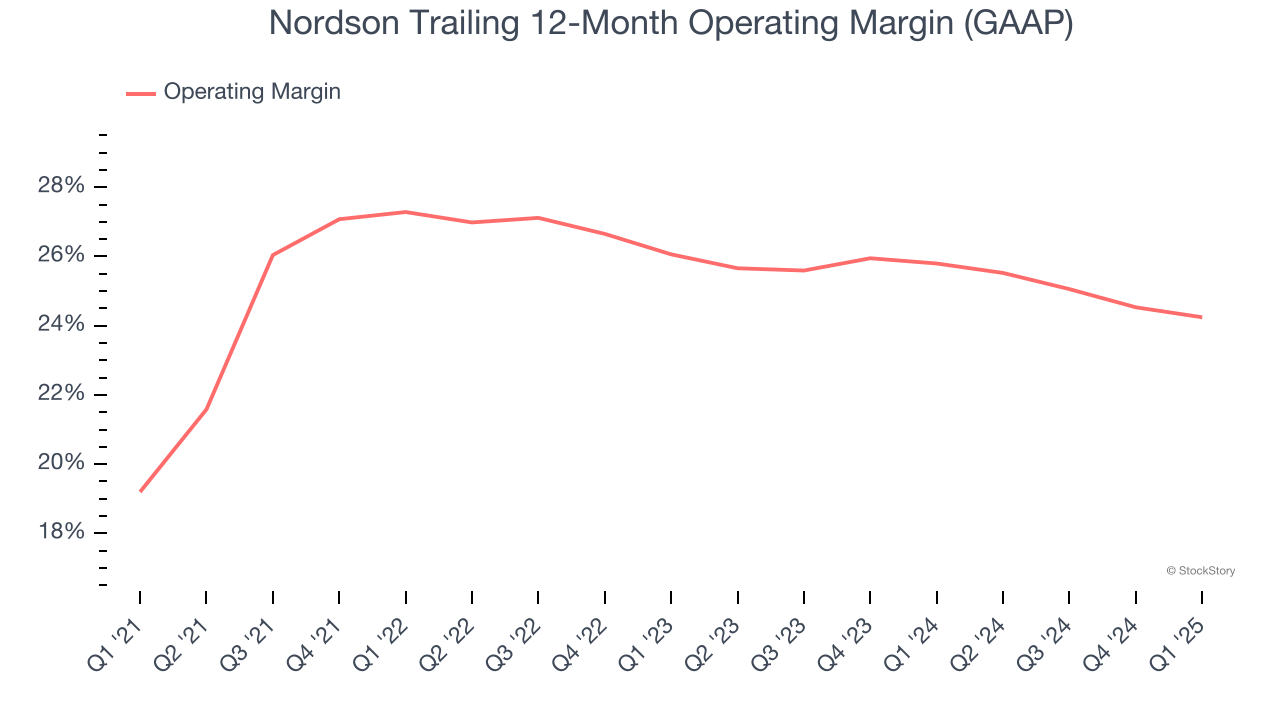
This quarter, Nordson generated an operating profit margin of 24.7%, down 1.2 percentage points year on year. Since Nordson’s gross margin decreased more than its operating margin, we can assume its recent inefficiencies were driven more by weaker leverage on its cost of sales rather than increased marketing, R&D, and administrative overhead expenses.
Earnings Per Share
We track the long-term change in earnings per share (EPS) for the same reason as long-term revenue growth. Compared to revenue, however, EPS highlights whether a company’s growth is profitable.
Nordson’s EPS grew at a decent 9.4% compounded annual growth rate over the last five years, higher than its 4.5% annualized revenue growth. This tells us the company became more profitable on a per-share basis as it expanded.
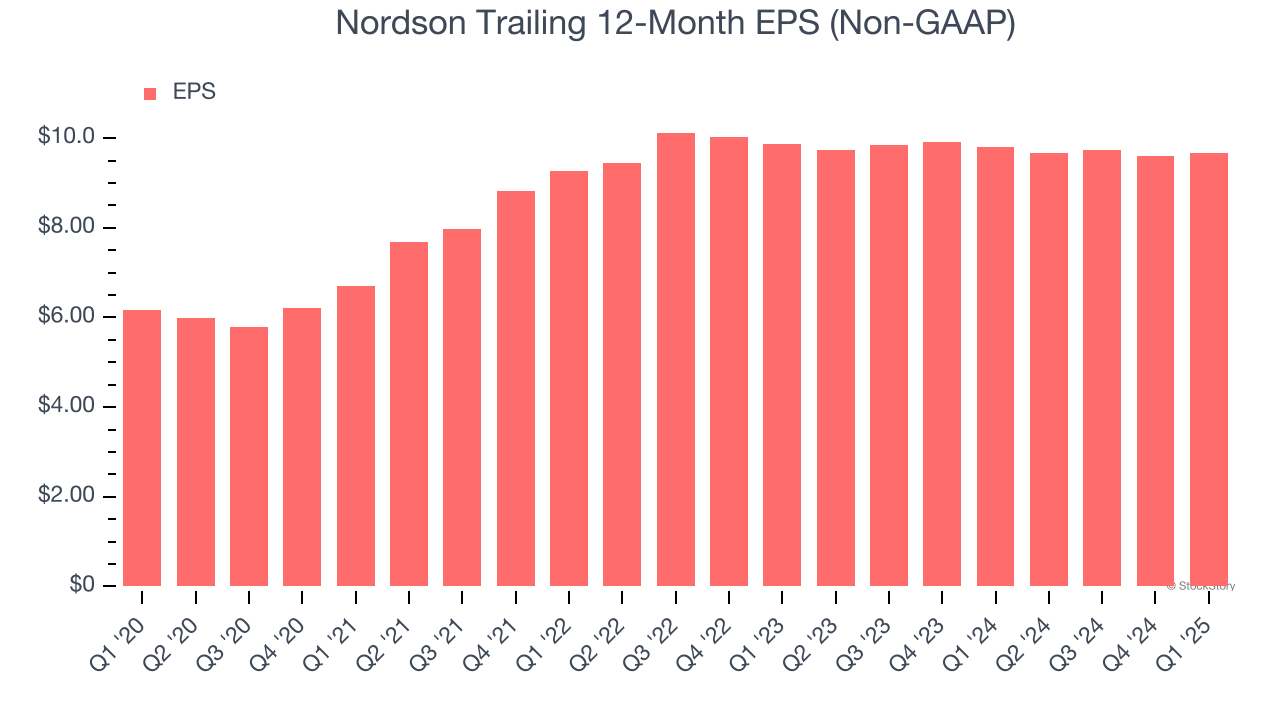
We can take a deeper look into Nordson’s earnings quality to better understand the drivers of its performance. As we mentioned earlier, Nordson’s operating margin declined this quarter but expanded by 5 percentage points over the last five years. Its share count also shrank by 2.1%, and these factors together are positive signs for shareholders because improving profitability and share buybacks turbocharge EPS growth relative to revenue growth. 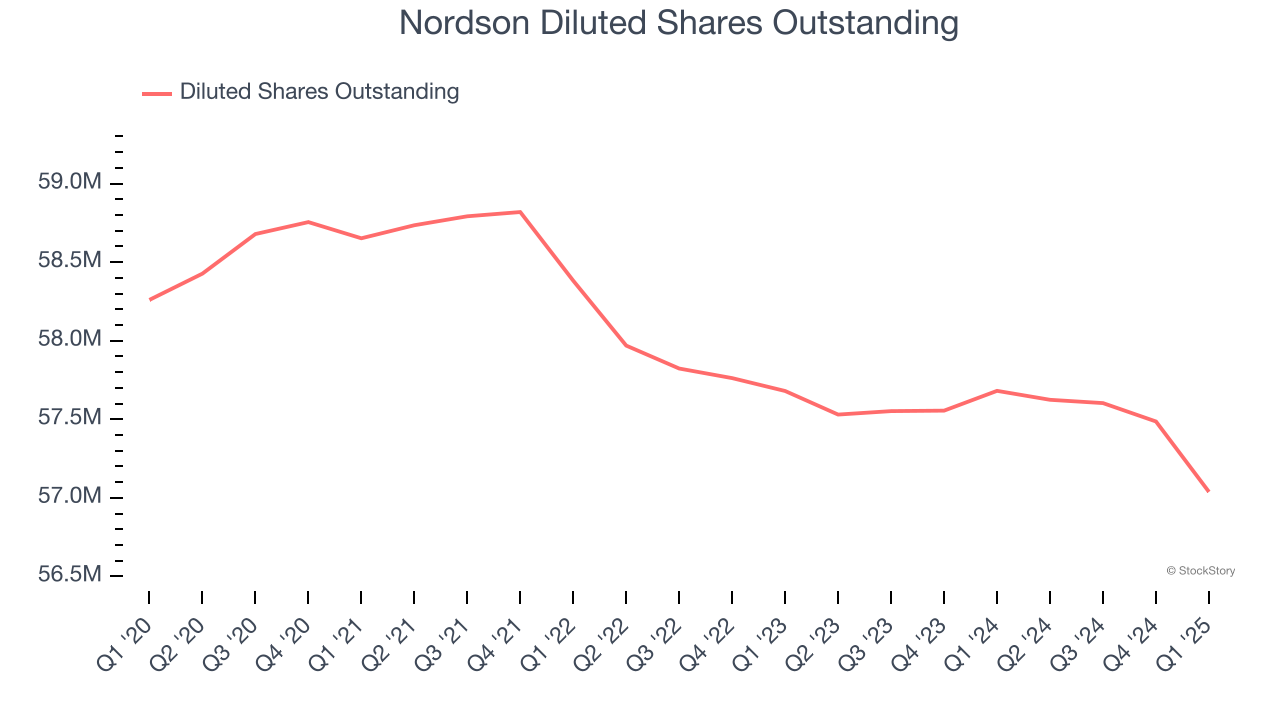
Like with revenue, we analyze EPS over a more recent period because it can provide insight into an emerging theme or development for the business.
For Nordson, EPS didn’t budge over the last two years, a regression from its five-year trend. We hope it can revert to earnings growth in the coming years.
In Q1, Nordson reported EPS at $2.42, up from $2.34 in the same quarter last year. This print beat analysts’ estimates by 2.6%. Over the next 12 months, Wall Street expects Nordson’s full-year EPS of $9.67 to grow 7.5%.
Key Takeaways from Nordson’s Q1 Results
It was encouraging to see Nordson’s revenue and EPS guidance for next quarter beat analysts’ expectations. We were also glad this quarter's EPS and EBITDA exceeded Wall Street’s estimates. We note that revenue also beat, but we take it lightly as organic revenue was in line. Regardless, this print had some key positives. The stock traded up 2.2% to $200 immediately after reporting.
Is Nordson an attractive investment opportunity right now? If you’re making that decision, you should consider the bigger picture of valuation, business qualities, as well as the latest earnings. We cover that in our actionable full research report which you can read here, it’s free.