
Healthcare technology company Phreesia (NYSE: PHR) reported Q1 CY2025 results exceeding the market’s revenue expectations, with sales up 14.5% year on year to $115.9 million. The company expects the full year’s revenue to be around $477 million, close to analysts’ estimates. Its GAAP loss of $0.07 per share was 35.6% above analysts’ consensus estimates.
Is now the time to buy Phreesia? Find out by accessing our full research report, it’s free.
Phreesia (PHR) Q1 CY2025 Highlights:
- Revenue: $115.9 million vs analyst estimates of $115.2 million (14.5% year-on-year growth, 0.6% beat)
- EPS (GAAP): -$0.07 vs analyst estimates of -$0.11 (35.6% beat)
- Adjusted EBITDA: $20.82 million vs analyst estimates of $16.75 million (18% margin, 24.3% beat)
- The company reconfirmed its revenue guidance for the full year of $477 million at the midpoint
- EBITDA guidance for the full year is $87.5 million at the midpoint, above analyst estimates of $81.46 million
- Operating Margin: -2.8%, up from -19.2% in the same quarter last year
- Free Cash Flow was $7.46 million, up from -$6.17 million in the same quarter last year
- Customers: 4,411, up from 4,341 in the previous quarter
- Market Capitalization: $1.48 billion
"Our fiscal year 2026 is off to a strong start. I am grateful to our team for their continued commitment to our mission, vision and values. I believe our performance is a reflection of our team truly living our values,” said CEO and Co-Founder Chaim Indig.
Company Overview
Founded in 2005 to streamline the traditionally paper-heavy patient check-in process, Phreesia (NYSE: PHR) provides software solutions that automate patient intake, registration, and payment processes for healthcare organizations while improving patient engagement in their care.
Sales Growth
Examining a company’s long-term performance can provide clues about its quality. Any business can have short-term success, but a top-tier one grows for years. Over the last five years, Phreesia grew its sales at an exceptional 27.3% compounded annual growth rate. Its growth beat the average healthcare company and shows its offerings resonate with customers.
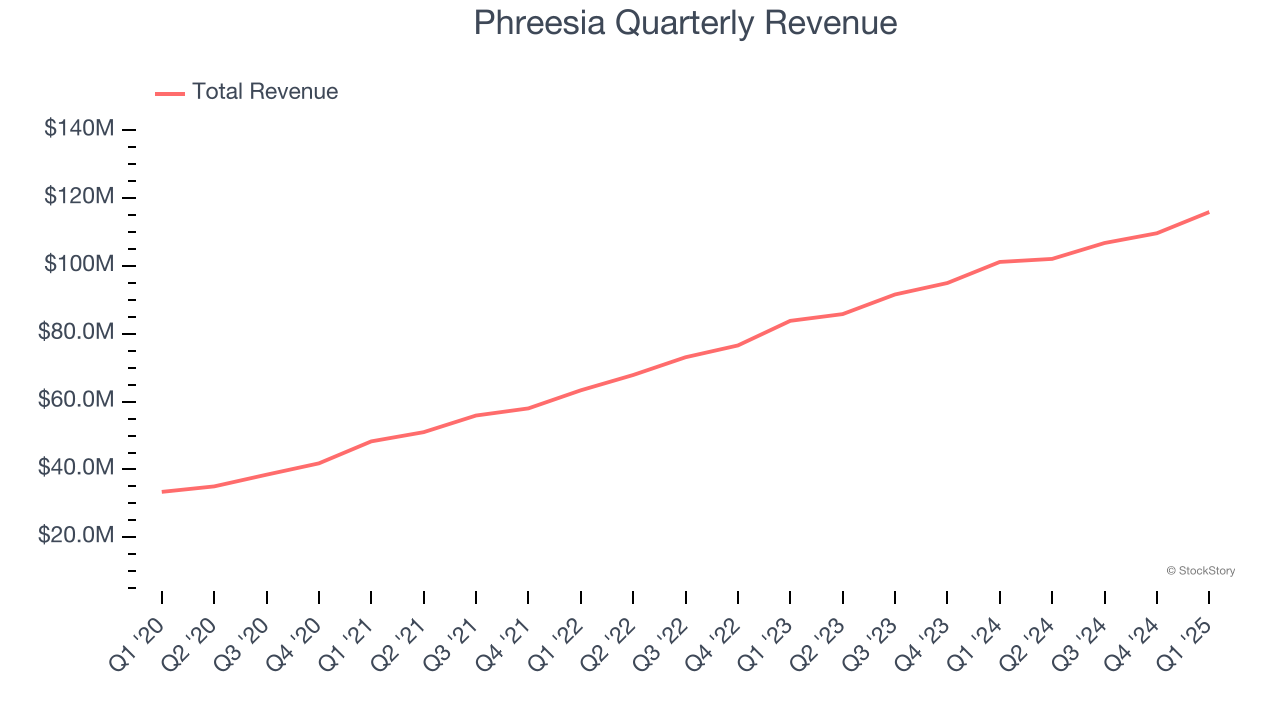
Long-term growth is the most important, but within healthcare, a half-decade historical view may miss new innovations or demand cycles. Phreesia’s annualized revenue growth of 20.1% over the last two years is below its five-year trend, but we still think the results suggest healthy demand. 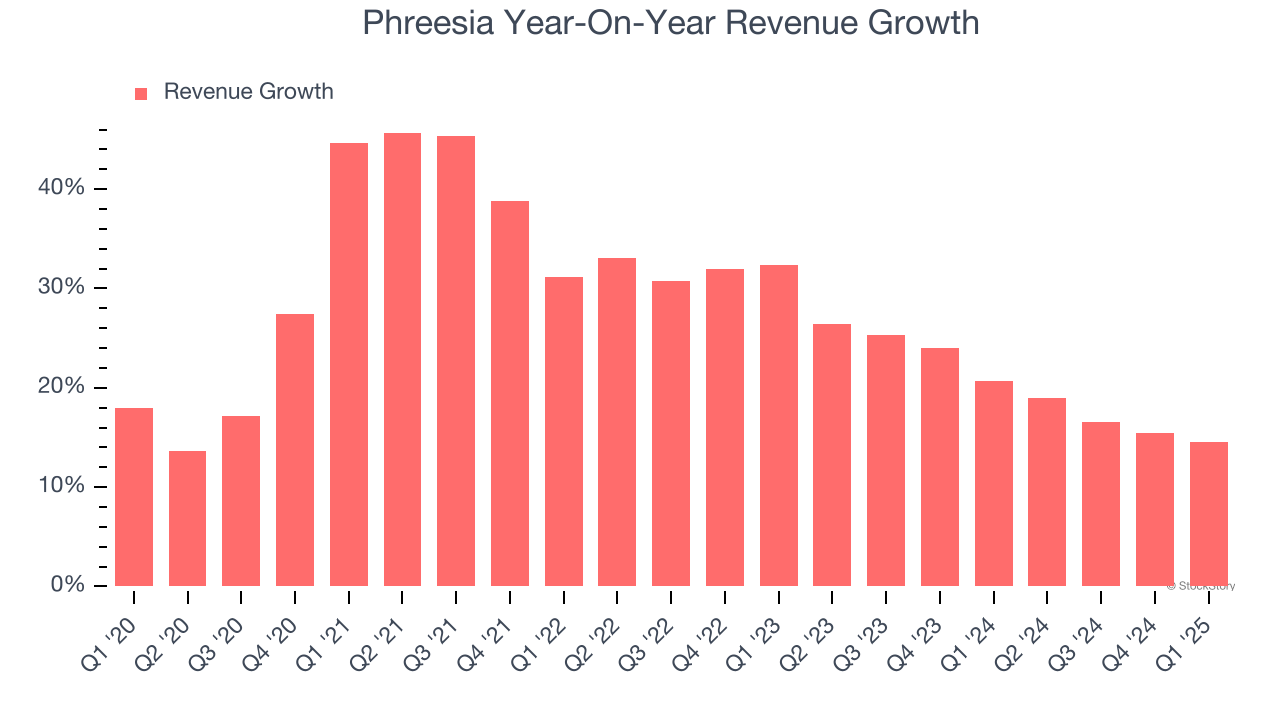
Phreesia also reports its number of customers, which reached 4,411 in the latest quarter. Over the last two years, Phreesia’s customer base averaged 18.8% year-on-year growth. Because this number is in line with its revenue growth, we can see the average customer spent roughly the same amount each year on the company’s products and services. 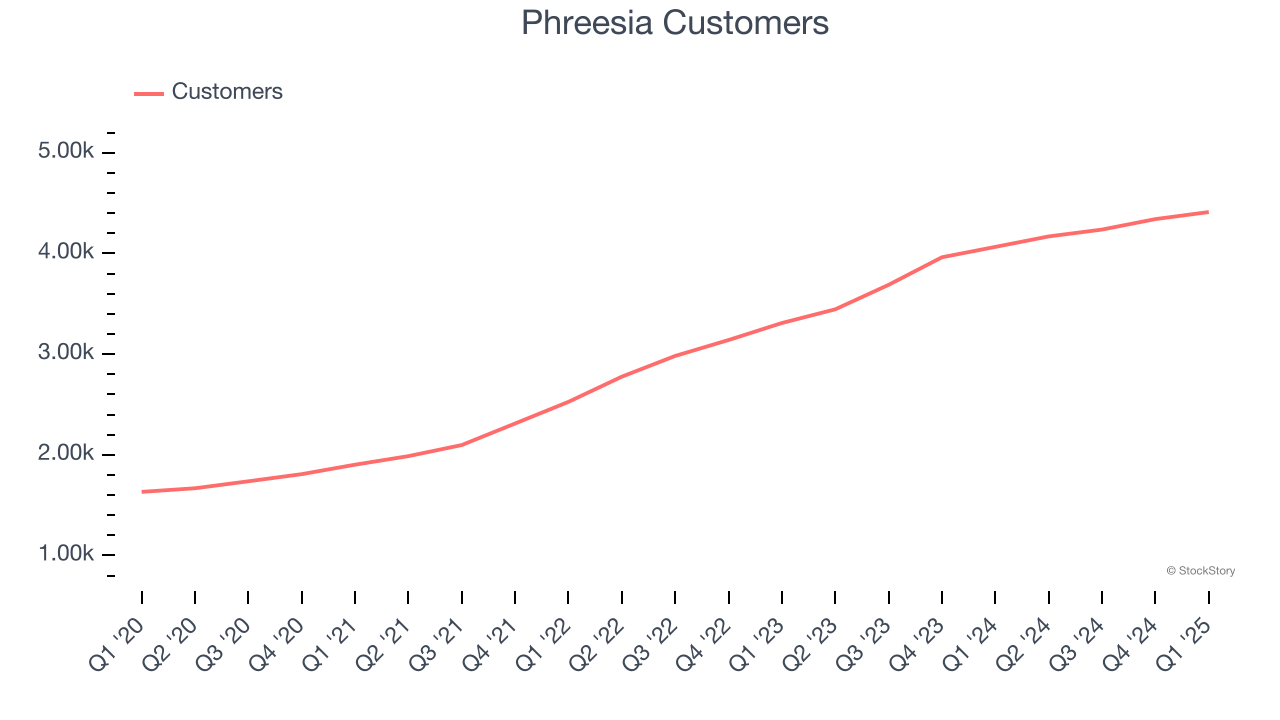
This quarter, Phreesia reported year-on-year revenue growth of 14.5%, and its $115.9 million of revenue exceeded Wall Street’s estimates by 0.6%.
Looking ahead, sell-side analysts expect revenue to grow 12.7% over the next 12 months, a deceleration versus the last two years. Still, this projection is noteworthy and suggests the market is forecasting success for its products and services.
Software is eating the world and there is virtually no industry left that has been untouched by it. That drives increasing demand for tools helping software developers do their jobs, whether it be monitoring critical cloud infrastructure, integrating audio and video functionality, or ensuring smooth content streaming. Click here to access a free report on our 3 favorite stocks to play this generational megatrend.
Operating Margin
Operating margin is a key measure of profitability. Think of it as net income - the bottom line - excluding the impact of taxes and interest on debt, which are less connected to business fundamentals.
Phreesia’s high expenses have contributed to an average operating margin of negative 34.1% over the last five years. Unprofitable healthcare companies require extra attention because they could get caught swimming naked when the tide goes out. It’s hard to trust that the business can endure a full cycle.
On the plus side, Phreesia’s operating margin rose by 9.5 percentage points over the last five years, as its sales growth gave it operating leverage. This performance was mostly driven by its recent improvements as the company’s margin has increased by 44.7 percentage points on a two-year basis.
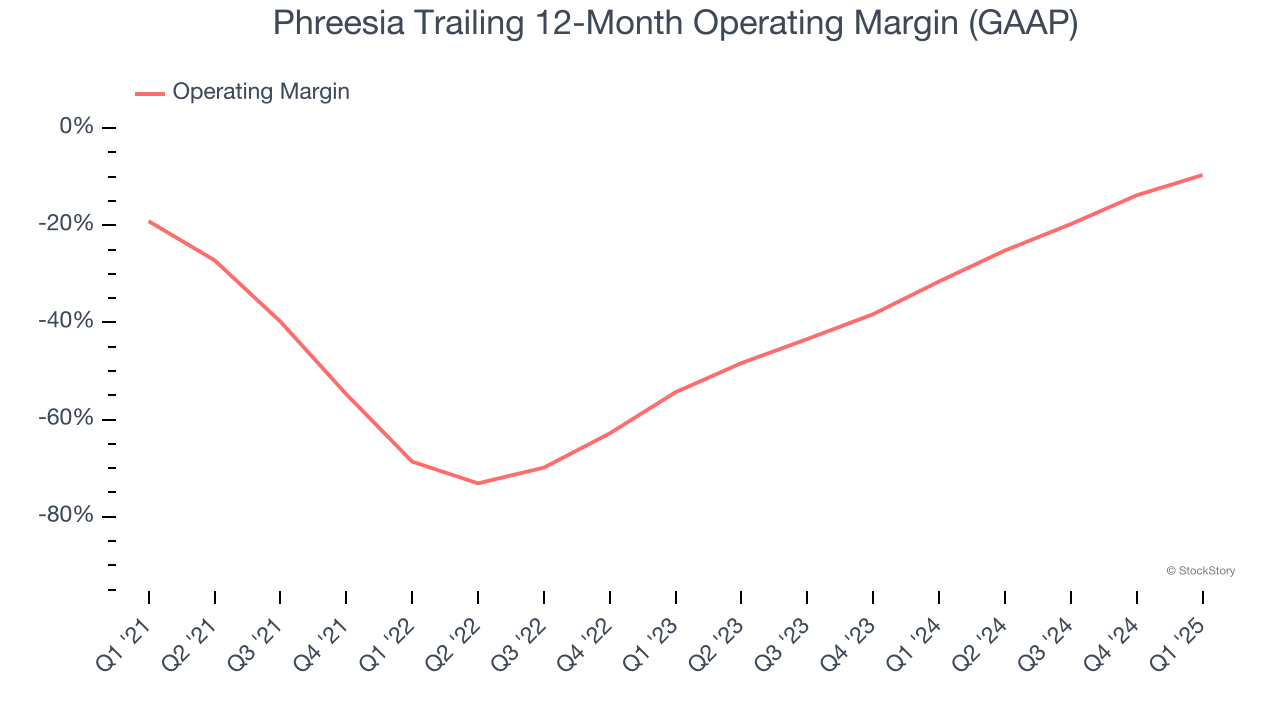
Phreesia’s operating margin was negative 2.8% this quarter. The company's consistent lack of profits raise a flag.
Earnings Per Share
We track the long-term change in earnings per share (EPS) for the same reason as long-term revenue growth. Compared to revenue, however, EPS highlights whether a company’s growth is profitable.
Although Phreesia’s full-year earnings are still negative, it reduced its losses and improved its EPS by 41.4% annually over the last five years. The next few quarters will be critical for assessing its long-term profitability.
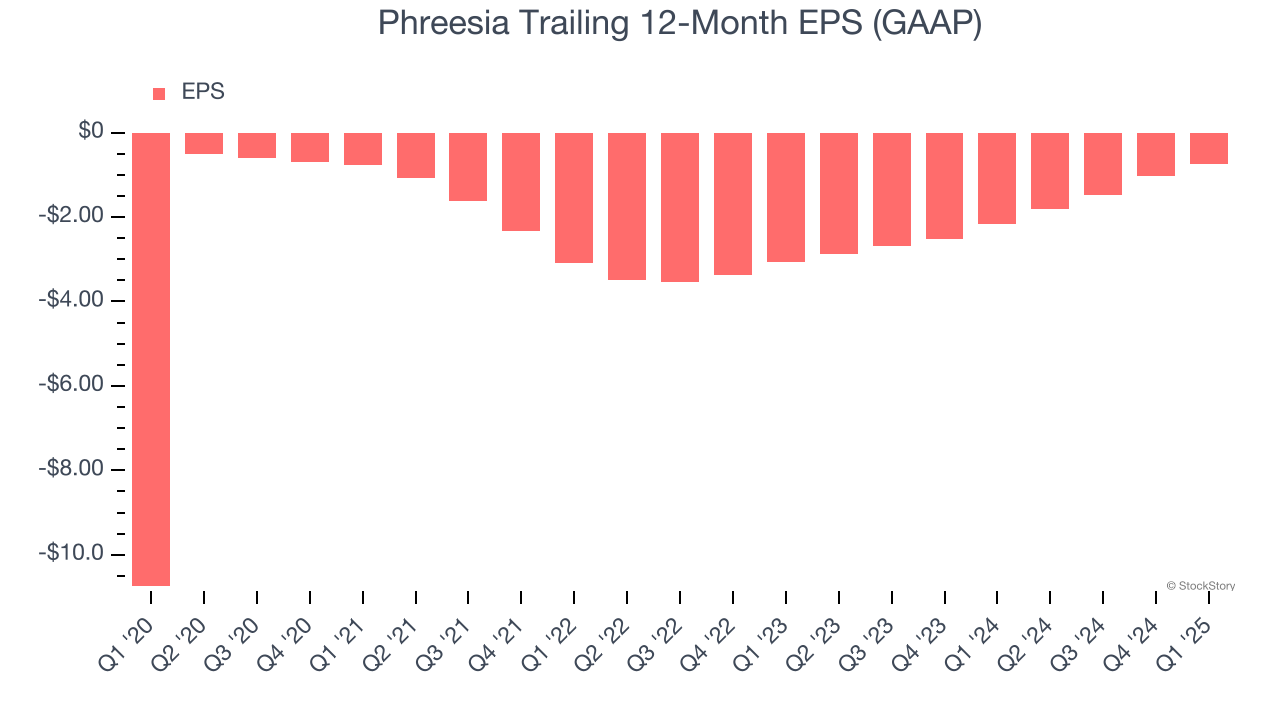
In Q1, Phreesia reported EPS at negative $0.07, up from negative $0.35 in the same quarter last year. This print easily cleared analysts’ estimates, and shareholders should be content with the results. Over the next 12 months, Wall Street is optimistic. Analysts forecast Phreesia’s full-year EPS of negative $0.74 will reach break even.
Key Takeaways from Phreesia’s Q1 Results
We were impressed by how significantly Phreesia blew past analysts’ EPS expectations this quarter. We were also glad its full-year EBITDA guidance exceeded Wall Street’s estimates. Overall, we think this was a solid quarter with some key areas of upside. The stock traded up 3.7% to $25.90 immediately following the results.
Phreesia may have had a good quarter, but does that mean you should invest right now? If you’re making that decision, you should consider the bigger picture of valuation, business qualities, as well as the latest earnings. We cover that in our actionable full research report which you can read here, it’s free.


