Footwear retailer Shoe Carnival (NASDAQ: SCVL) missed Wall Street’s revenue expectations in Q1 CY2025, with sales falling 7.5% year on year to $277.7 million. On the other hand, the company’s full-year revenue guidance of $1.19 billion at the midpoint came in 1.9% above analysts’ estimates. Its GAAP profit of $0.34 per share was 47.8% above analysts’ consensus estimates.
Is now the time to buy Shoe Carnival? Find out by accessing our full research report, it’s free.
Shoe Carnival (SCVL) Q1 CY2025 Highlights:
- Revenue: $277.7 million vs analyst estimates of $282.5 million (7.5% year-on-year decline, 1.7% miss)
- EPS (GAAP): $0.34 vs analyst estimates of $0.23 (47.8% beat)
- Adjusted EBITDA: $12.05 million vs analyst estimates of $15.3 million (4.3% margin, 21.3% miss)
- The company reconfirmed its revenue guidance for the full year of $1.19 billion at the midpoint
- EPS (GAAP) guidance for the full year is $1.85 at the midpoint, beating analyst estimates by 3.9%
- Operating Margin: 4.3%, down from 7.7% in the same quarter last year
- Free Cash Flow was -$22.98 million, down from $6.87 million in the same quarter last year
- Same-Store Sales fell 8.1% year on year (-3.4% in the same quarter last year)
- Market Capitalization: $504 million
“Our first quarter results reflect the continued success of our strategic transformation, with profits outperforming expectations by approximately 10 percent despite the challenging macroeconomic and retail environment,” said Mark Worden, President and Chief Executive Officer.
Company Overview
Known for its playful atmosphere that features carnival elements, Shoe Carnival (NASDAQ: SCVL) is a retailer that sells footwear from mainstream brands for the entire family.
Sales Growth
Examining a company’s long-term performance can provide clues about its quality. Any business can experience short-term success, but top-performing ones enjoy sustained growth for years.
With $1.18 billion in revenue over the past 12 months, Shoe Carnival is a small retailer, which sometimes brings disadvantages compared to larger competitors benefiting from economies of scale and negotiating leverage with suppliers.
As you can see below, Shoe Carnival grew its sales at a sluggish 2.4% compounded annual growth rate over the last six years (we compare to 2019 to normalize for COVID-19 impacts).
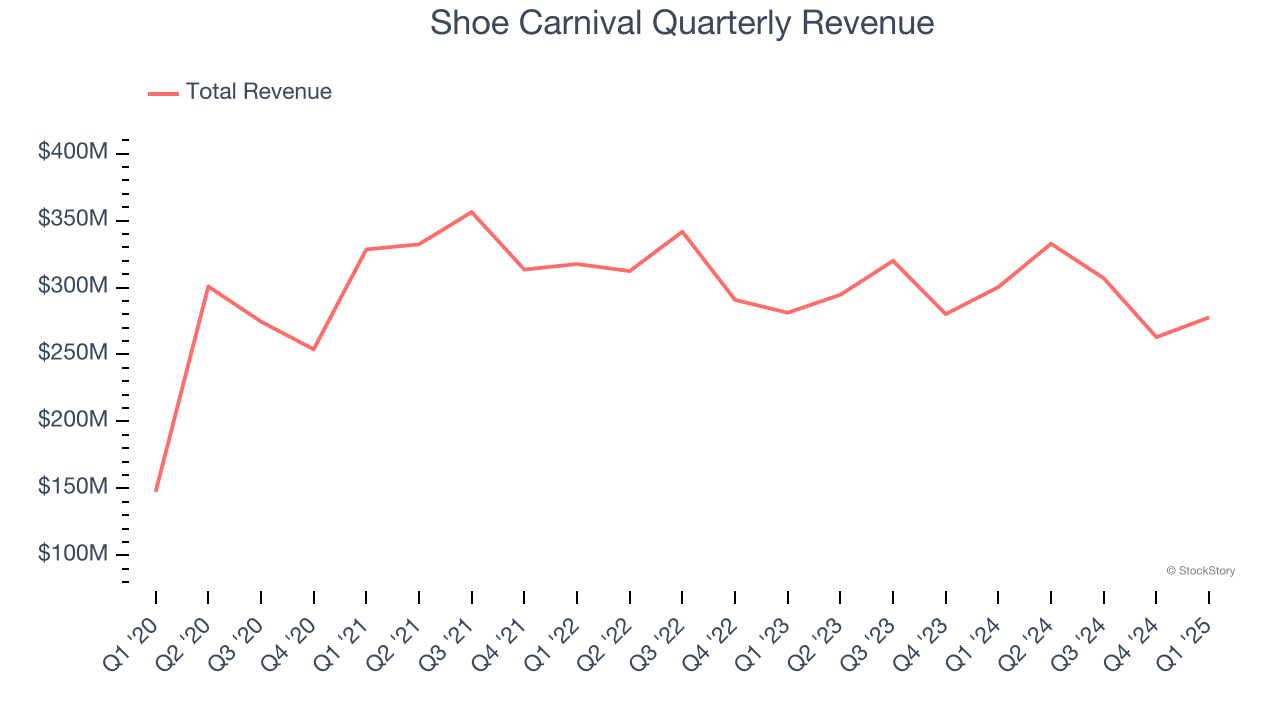
This quarter, Shoe Carnival missed Wall Street’s estimates and reported a rather uninspiring 7.5% year-on-year revenue decline, generating $277.7 million of revenue.
Looking ahead, sell-side analysts expect revenue to remain flat over the next 12 months, a slight deceleration versus the last six years. This projection is underwhelming and suggests its products will face some demand challenges.
Software is eating the world and there is virtually no industry left that has been untouched by it. That drives increasing demand for tools helping software developers do their jobs, whether it be monitoring critical cloud infrastructure, integrating audio and video functionality, or ensuring smooth content streaming. Click here to access a free report on our 3 favorite stocks to play this generational megatrend.
Store Performance
Number of Stores
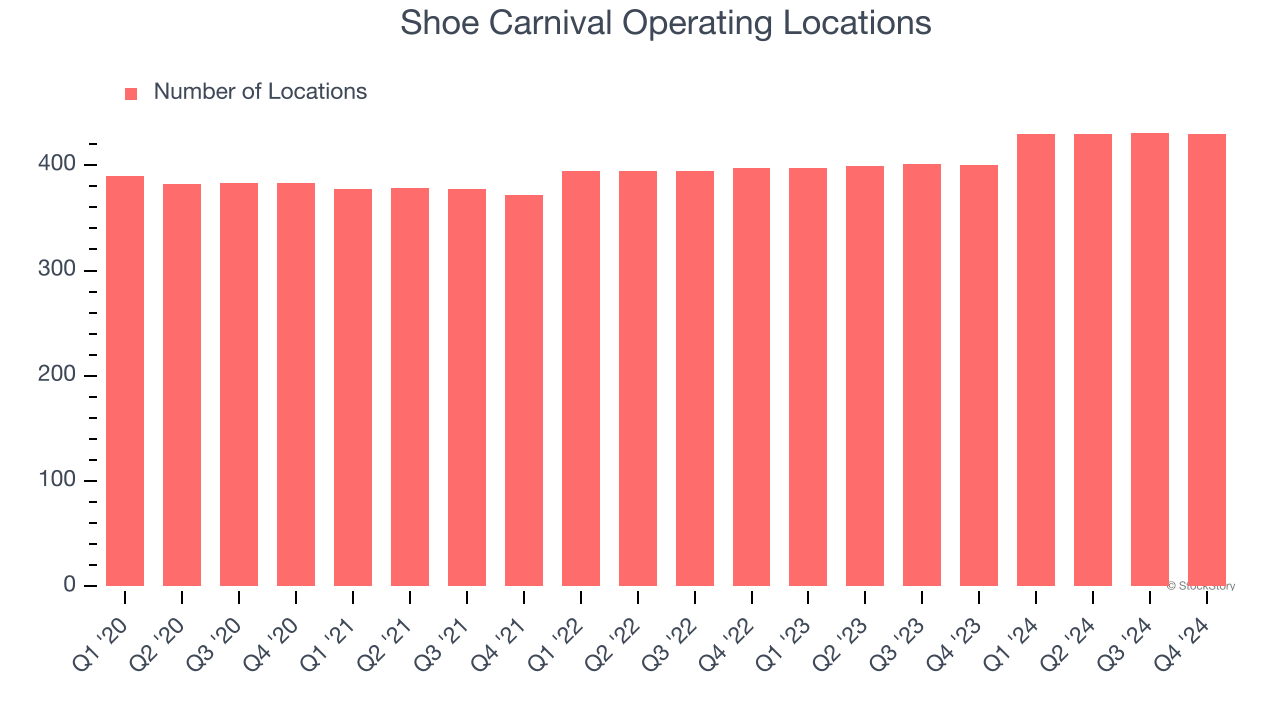
A retailer’s store count influences how much it can sell and how quickly revenue can grow.
Shoe Carnival opened new stores at a rapid clip over the last two years, averaging 4.9% annual growth, much faster than the broader consumer retail sector. This gives it a chance to scale into a mid-sized business over time.
When a retailer opens new stores, it usually means it’s investing for growth because demand is greater than supply, especially in areas where consumers may not have a store within reasonable driving distance.
Note that Shoe Carnival reports its store count intermittently, so some data points are missing in the chart below.
Same-Store Sales
A company's store base only paints one part of the picture. When demand is high, it makes sense to open more. But when demand is low, it’s prudent to close some locations and use the money in other ways. Same-store sales gives us insight into this topic because it measures organic growth for a retailer's e-commerce platform and brick-and-mortar shops that have existed for at least a year.
Shoe Carnival’s demand has been shrinking over the last two years as its same-store sales have averaged 5.9% annual declines. This performance is concerning - it shows Shoe Carnival artificially boosts its revenue by building new stores. We’d like to see a company’s same-store sales rise before it takes on the costly, capital-intensive endeavor of expanding its store base.
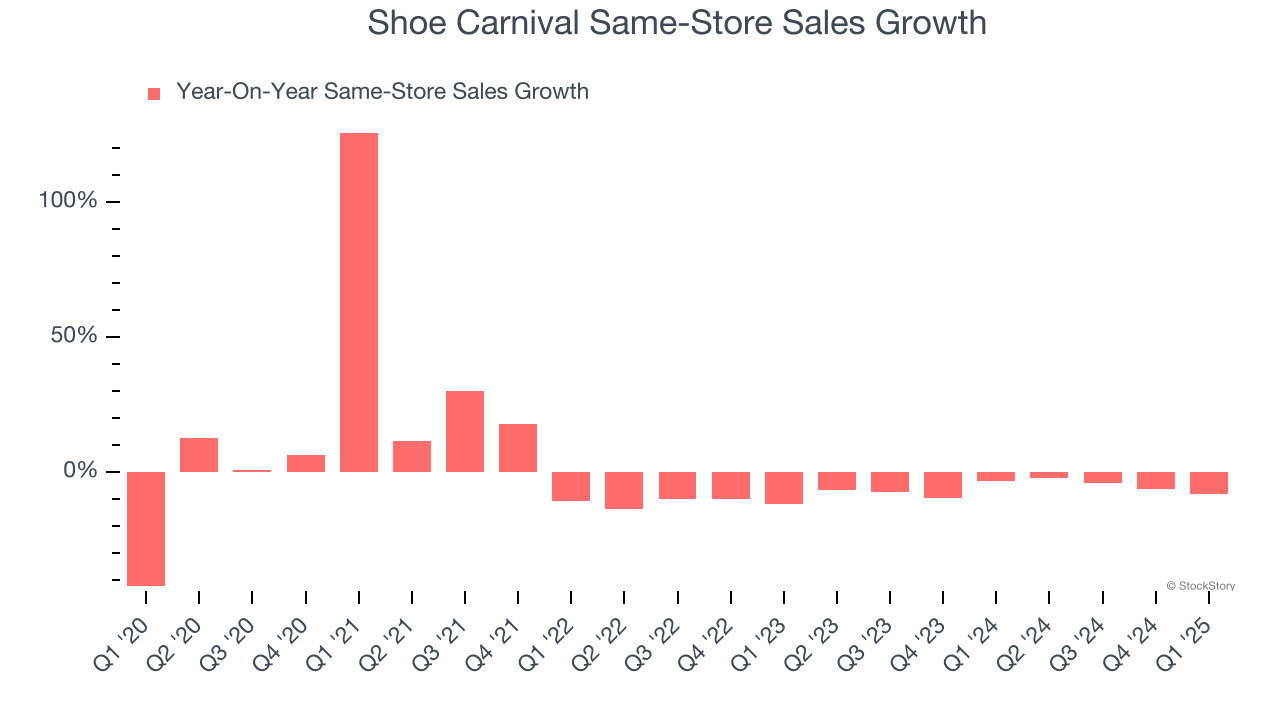
In the latest quarter, Shoe Carnival’s same-store sales fell by 8.1% year on year. This decrease represents a further deceleration from its historical levels. We hope the business can get back on track.
Key Takeaways from Shoe Carnival’s Q1 Results
We were impressed by how significantly Shoe Carnival blew past analysts’ EPS expectations this quarter. We were also glad its full-year revenue and EPS guidance exceeded Wall Street’s estimates. On the other hand, its revenue and EBITDA fell short. Overall, this print was mixed but still had some key positives. The stock traded up 11.2% to $20.54 immediately after reporting.
So should you invest in Shoe Carnival right now? We think that the latest quarter is only one piece of the longer-term business quality puzzle. Quality, when combined with valuation, can help determine if the stock is a buy. We cover that in our actionable full research report which you can read here, it’s free.


