
Video software platform Vimeo (NASDAQ: VMEO) reported Q1 CY2025 results beating Wall Street’s revenue expectations, but sales fell by 1.8% year on year to $103 million. Its GAAP loss of $0.02 per share was in line with analysts’ consensus estimates.
Is now the time to buy Vimeo? Find out by accessing our full research report, it’s free.
Vimeo (VMEO) Q1 CY2025 Highlights:
- Revenue: $103 million vs analyst estimates of $101.4 million (1.8% year-on-year decline, 1.6% beat)
- EPS (GAAP): -$0.02 vs analyst estimates of -$0.03 (in line)
- Adjusted EBITDA: $12.2 million vs analyst estimates of $1.08 million (11.8% margin, significant beat)
- EBITDA guidance for the full year is $27.5 million at the midpoint, below analyst estimates of $28.28 million
- Operating Margin: 0%, down from 2.5% in the same quarter last year
- Free Cash Flow Margin: 6.7%, up from 5.2% in the same quarter last year
- Market Capitalization: $844 million
Company Overview
Originally launched in 2004 as a platform for filmmakers seeking a high-quality alternative to YouTube, Vimeo (NASDAQ: VMEO) provides cloud-based video creation, editing, hosting, and distribution software that helps businesses and creators make, manage, and share professional-quality videos.
Sales Growth
Reviewing a company’s long-term sales performance reveals insights into its quality. Any business can put up a good quarter or two, but the best consistently grow over the long haul.
With $415.1 million in revenue over the past 12 months, Vimeo is a small player in the business services space, which sometimes brings disadvantages compared to larger competitors benefiting from economies of scale and numerous distribution channels. On the bright side, it can grow faster because it has more room to expand.
As you can see below, Vimeo grew its sales at an exceptional 14.7% compounded annual growth rate over the last five years. This shows it had high demand, a useful starting point for our analysis.
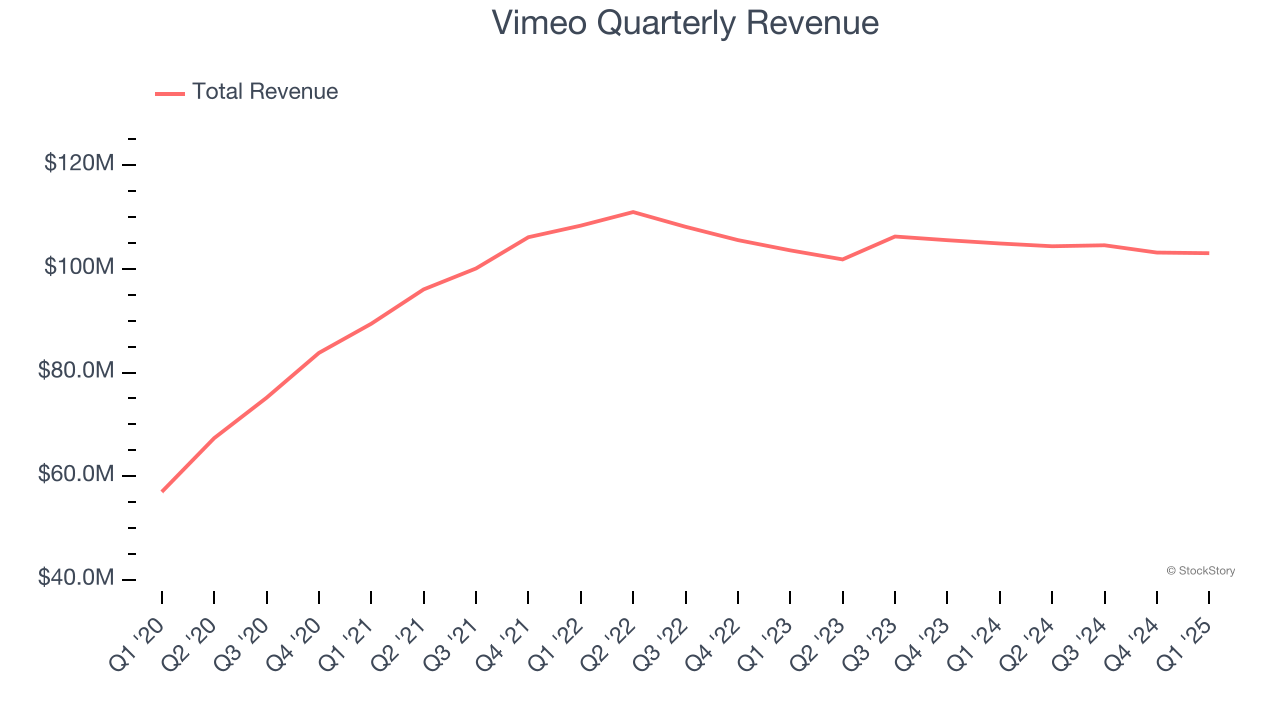
Long-term growth is the most important, but within business services, a half-decade historical view may miss new innovations or demand cycles. Vimeo’s recent performance marks a sharp pivot from its five-year trend as its revenue has shown annualized declines of 1.5% over the last two years. 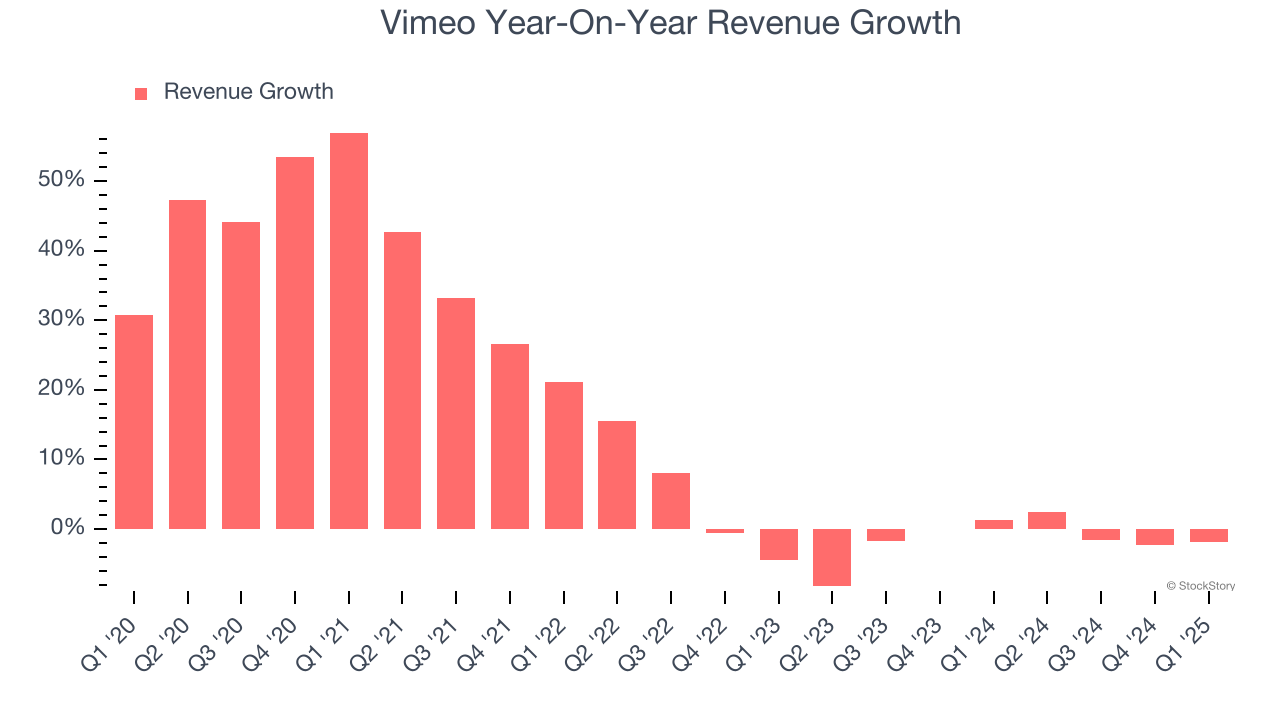
This quarter, Vimeo’s revenue fell by 1.8% year on year to $103 million but beat Wall Street’s estimates by 1.6%.
Looking ahead, sell-side analysts expect revenue to grow 2.2% over the next 12 months. Although this projection implies its newer products and services will catalyze better top-line performance, it is still below the sector average.
Here at StockStory, we certainly understand the potential of thematic investing. Diverse winners from Microsoft (MSFT) to Alphabet (GOOG), Coca-Cola (KO) to Monster Beverage (MNST) could all have been identified as promising growth stories with a megatrend driving the growth. So, in that spirit, we’ve identified a relatively under-the-radar profitable growth stock benefiting from the rise of AI, available to you FREE via this link.
Operating Margin
Operating margin is one of the best measures of profitability because it tells us how much money a company takes home after subtracting all core expenses, like marketing and R&D.
Although Vimeo broke even this quarter from an operational perspective, it’s generally struggled over a longer time period. Its expensive cost structure has contributed to an average operating margin of negative 6.8% over the last five years. Unprofitable business services companies require extra attention because they could get caught swimming naked when the tide goes out. It’s hard to trust that the business can endure a full cycle.
On the plus side, Vimeo’s operating margin rose by 13.1 percentage points over the last five years, as its sales growth gave it operating leverage. Still, it will take much more for the company to reach long-term profitability.
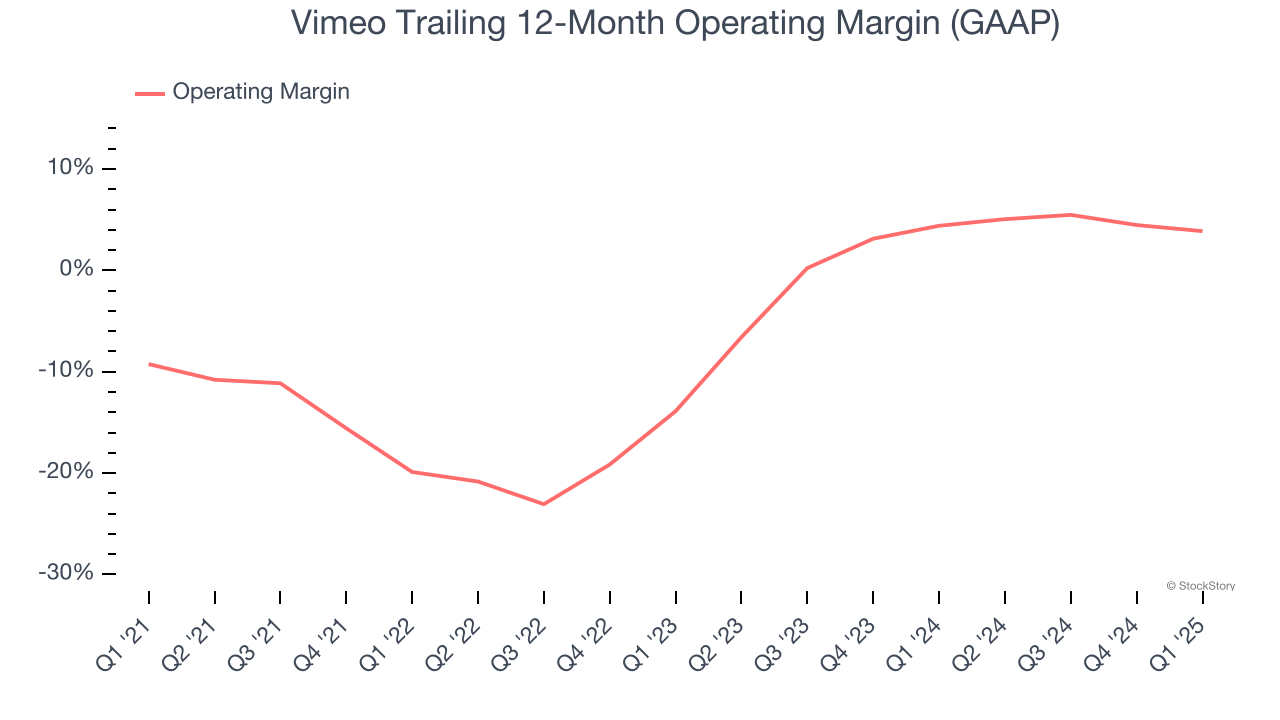
This quarter, Vimeo’s breakeven margin was down 2.5 percentage points year on year. This contraction shows it was less efficient because its expenses increased relative to its revenue.
Earnings Per Share
Revenue trends explain a company’s historical growth, but the long-term change in earnings per share (EPS) points to the profitability of that growth – for example, a company could inflate its sales through excessive spending on advertising and promotions.
Vimeo’s full-year EPS flipped from negative to positive over the last five years. This is encouraging and shows it’s at a critical moment in its life.
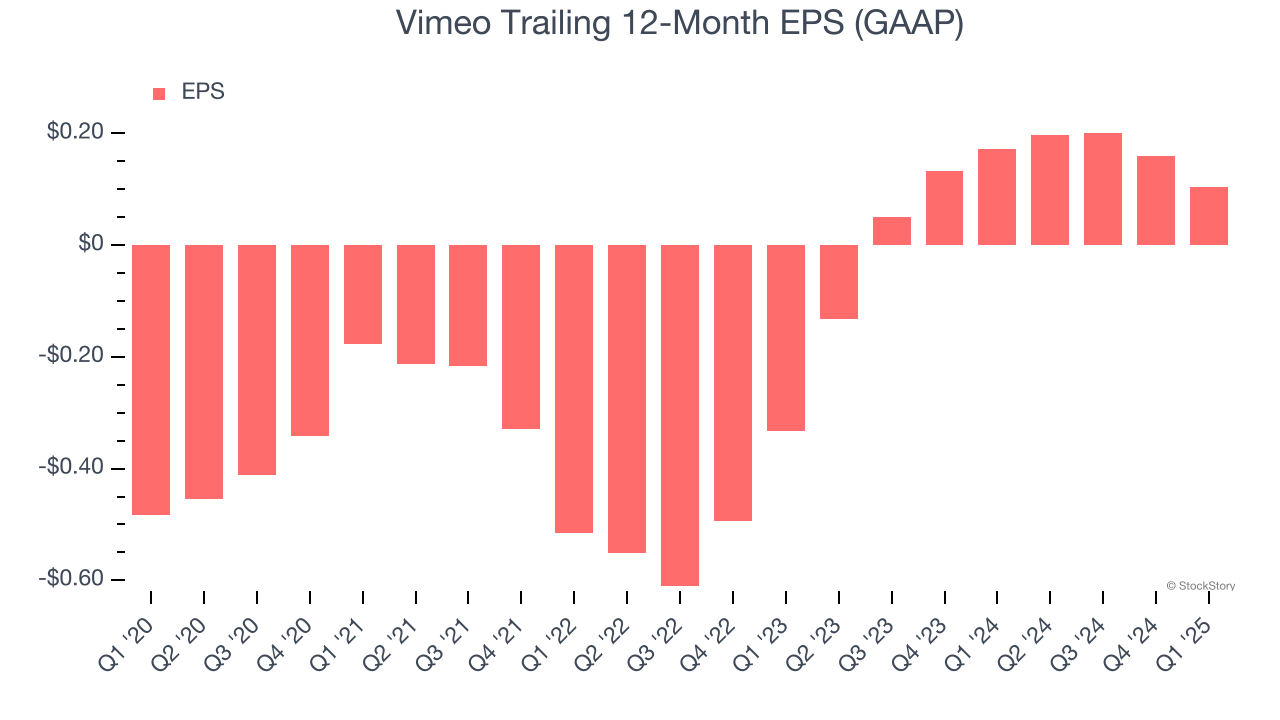
In Q1, Vimeo reported EPS at negative $0.02, down from $0.04 in the same quarter last year. Despite falling year on year, this print easily cleared analysts’ estimates. Over the next 12 months, Wall Street expects Vimeo to perform poorly. Analysts forecast its full-year EPS of $0.10 will hit $0.03.
Key Takeaways from Vimeo’s Q1 Results
We were impressed by how significantly Vimeo blew past analysts’ EPS expectations this quarter. We were also happy its revenue outperformed Wall Street’s estimates. On the other hand, its full-year EBITDA guidance missed. Zooming out, we think this quarter was mixed. The areas below expectations seem to be driving the move, and shares traded down 2.8% to $5.01 immediately after reporting.
So should you invest in Vimeo right now? When making that decision, it’s important to consider its valuation, business qualities, as well as what has happened in the latest quarter. We cover that in our actionable full research report which you can read here, it’s free.