
Aerospace and defense company Ducommun (NYSE: DCO) reported Q1 CY2025 results exceeding the market’s revenue expectations, with sales up 1.7% year on year to $194.1 million. Its non-GAAP profit of $0.83 per share was 18.1% above analysts’ consensus estimates.
Is now the time to buy Ducommun? Find out by accessing our full research report, it’s free.
Ducommun (DCO) Q1 CY2025 Highlights:
- Revenue: $194.1 million vs analyst estimates of $192.8 million (1.7% year-on-year growth, 0.7% beat)
- Adjusted EPS: $0.83 vs analyst estimates of $0.70 (18.1% beat)
- Adjusted EBITDA: $30.93 million vs analyst estimates of $27.94 million (15.9% margin, 10.7% beat)
- Operating Margin: 8.5%, up from 6.6% in the same quarter last year
- Backlog: $1.05 billion at quarter end, in line with the same quarter last year
- Market Capitalization: $870.2 million
“An excellent start to 2025 for Ducommun as we continue to make good progress towards our VISION 2027 goals with record gross margins during the quarter along with strong Adjusted EBITDA margins. Net revenue grew 2% to $194.1 million driven by strength in our defense business which helped us overcome the anticipated weakness in commercial aerospace production rates along with destocking,” said Stephen G. Oswald, chairman, president and chief executive officer.
Company Overview
California’s oldest company, Ducommun (NYSE: DCO) is a provider of engineering and manufacturing services for high-performance products primarily within the aerospace and defense industries.
Sales Growth
A company’s long-term performance is an indicator of its overall quality. Even a bad business can shine for one or two quarters, but a top-tier one grows for years. Unfortunately, Ducommun’s 1.8% annualized revenue growth over the last five years was sluggish. This fell short of our benchmarks and is a poor baseline for our analysis.
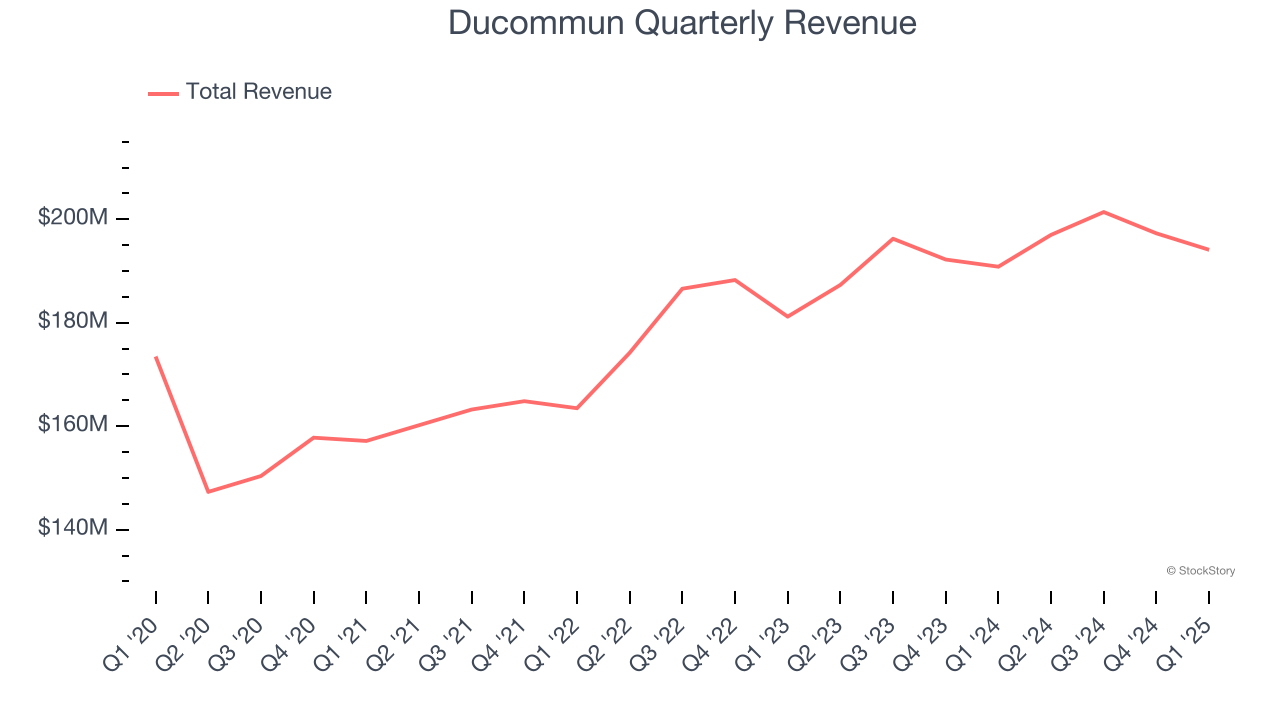
We at StockStory place the most emphasis on long-term growth, but within industrials, a half-decade historical view may miss cycles, industry trends, or a company capitalizing on catalysts such as a new contract win or a successful product line. Ducommun’s annualized revenue growth of 4% over the last two years is above its five-year trend, but we were still disappointed by the results. 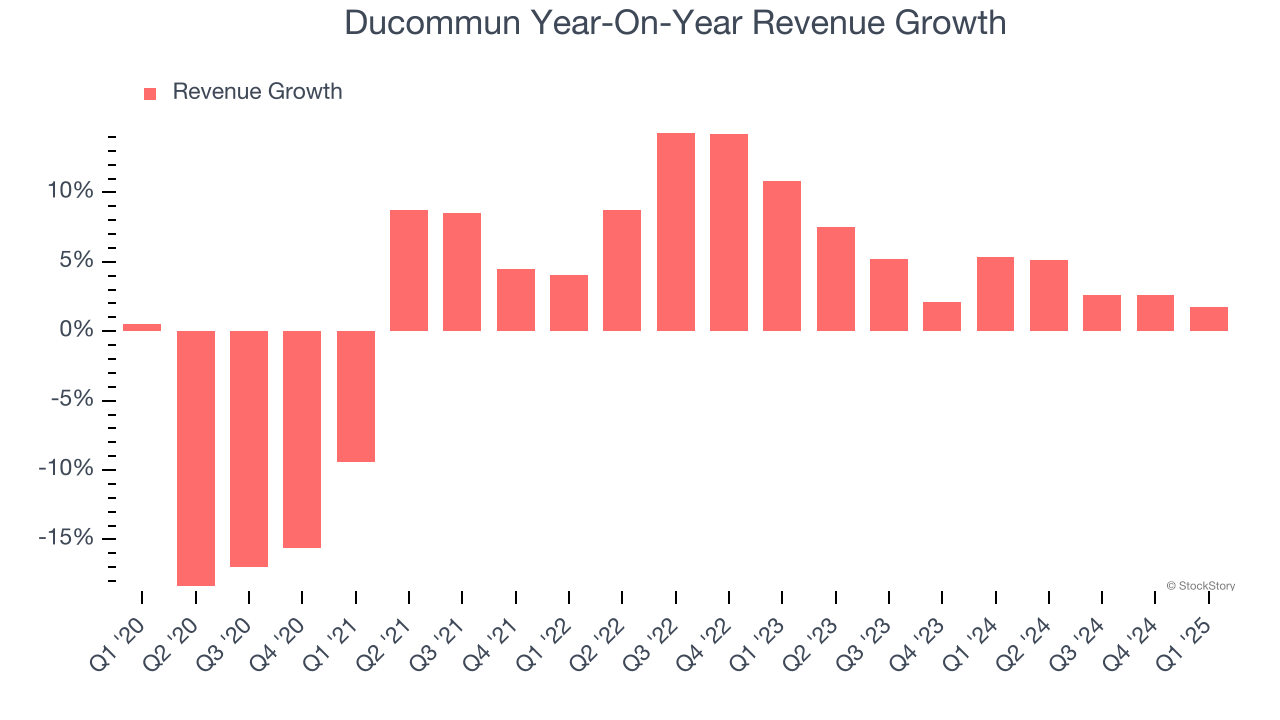
Ducommun also reports its backlog, or the value of its outstanding orders that have not yet been executed or delivered. Ducommun’s backlog reached $1.05 billion in the latest quarter and averaged 4.8% year-on-year growth over the last two years. Because this number is in line with its revenue growth, we can see the company effectively balanced its new order intake and fulfillment processes. 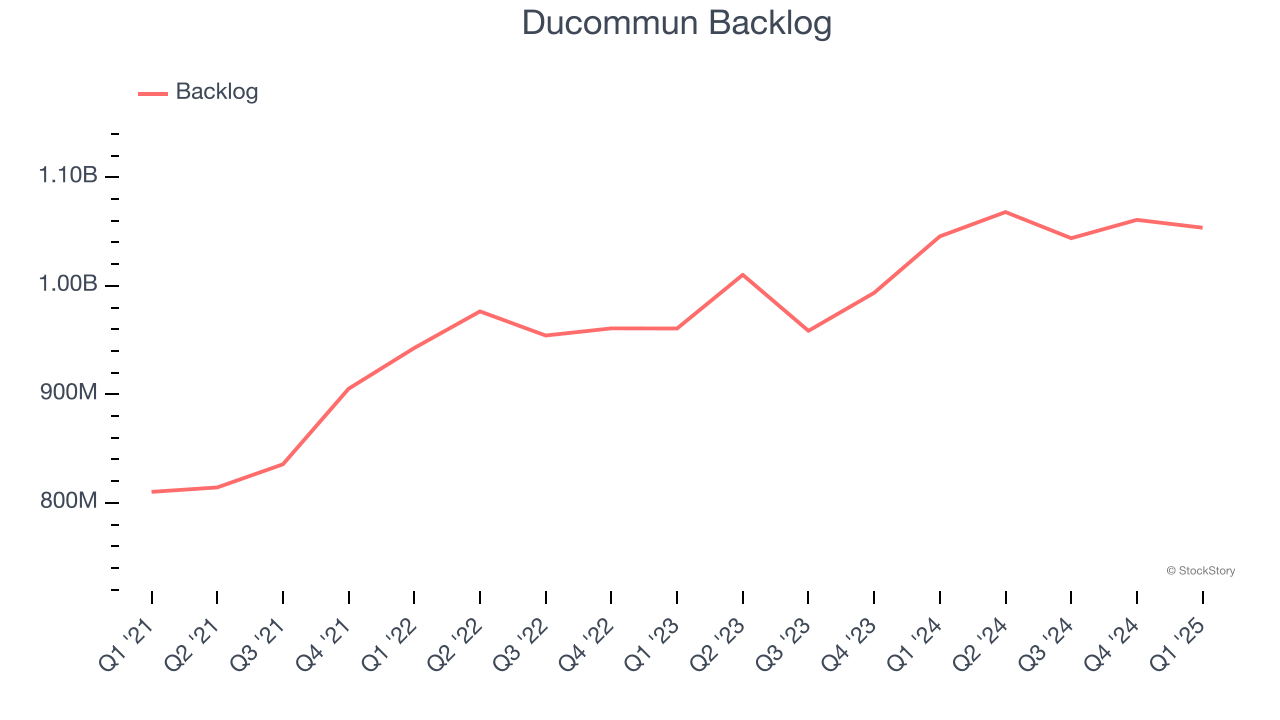
This quarter, Ducommun reported modest year-on-year revenue growth of 1.7% but beat Wall Street’s estimates by 0.7%.
Looking ahead, sell-side analysts expect revenue to grow 5.5% over the next 12 months, similar to its two-year rate. While this projection suggests its newer products and services will spur better top-line performance, it is still below the sector average.
Here at StockStory, we certainly understand the potential of thematic investing. Diverse winners from Microsoft (MSFT) to Alphabet (GOOG), Coca-Cola (KO) to Monster Beverage (MNST) could all have been identified as promising growth stories with a megatrend driving the growth. So, in that spirit, we’ve identified a relatively under-the-radar profitable growth stock benefiting from the rise of AI, available to you FREE via this link.
Operating Margin
Ducommun was profitable over the last five years but held back by its large cost base. Its average operating margin of 6.2% was weak for an industrials business.
Analyzing the trend in its profitability, Ducommun’s operating margin might fluctuated slightly but has generally stayed the same over the last five years. This raises questions about the company’s expense base because its revenue growth should have given it leverage on its fixed costs, resulting in better economies of scale and profitability.
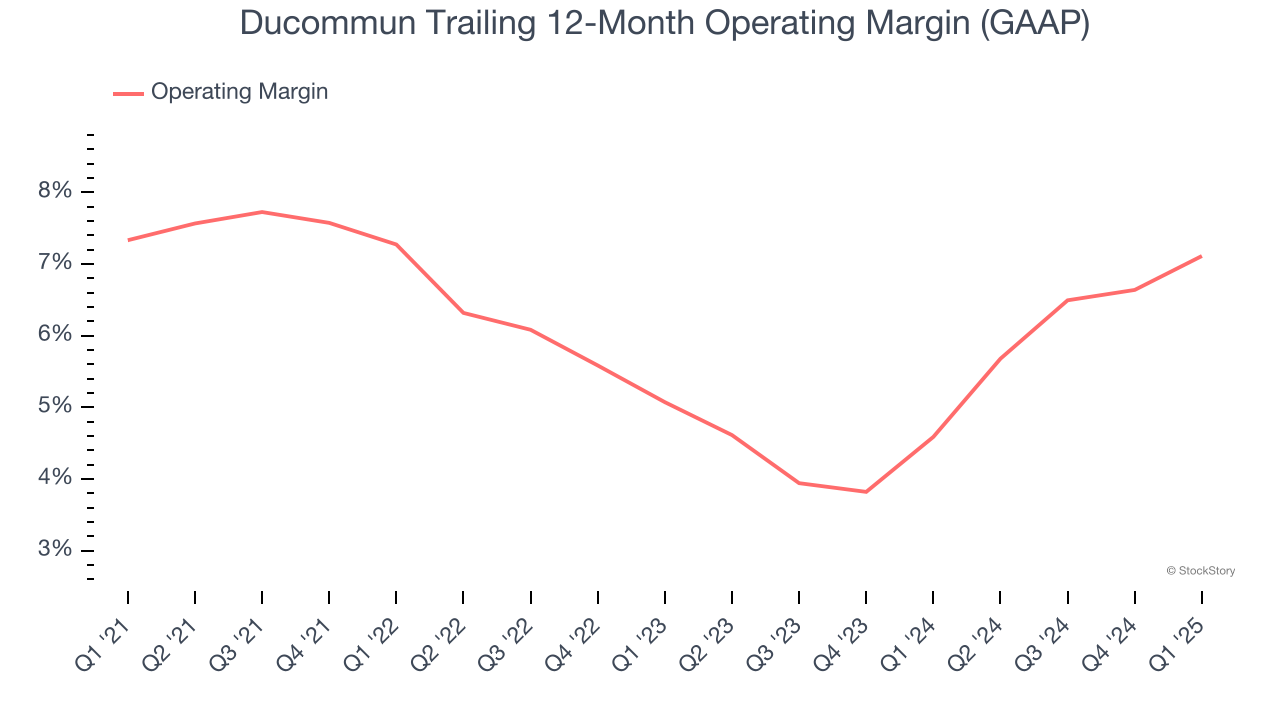
This quarter, Ducommun generated an operating profit margin of 8.5%, up 1.9 percentage points year on year. This increase was a welcome development and shows it was more efficient.
Earnings Per Share
Revenue trends explain a company’s historical growth, but the long-term change in earnings per share (EPS) points to the profitability of that growth – for example, a company could inflate its sales through excessive spending on advertising and promotions.
Ducommun’s EPS grew at a weak 3.8% compounded annual growth rate over the last five years. This performance was better than its flat revenue, but we take it with a grain of salt because its operating margin didn’t expand and it didn’t repurchase its shares, meaning the delta came from reduced interest expenses or taxes.
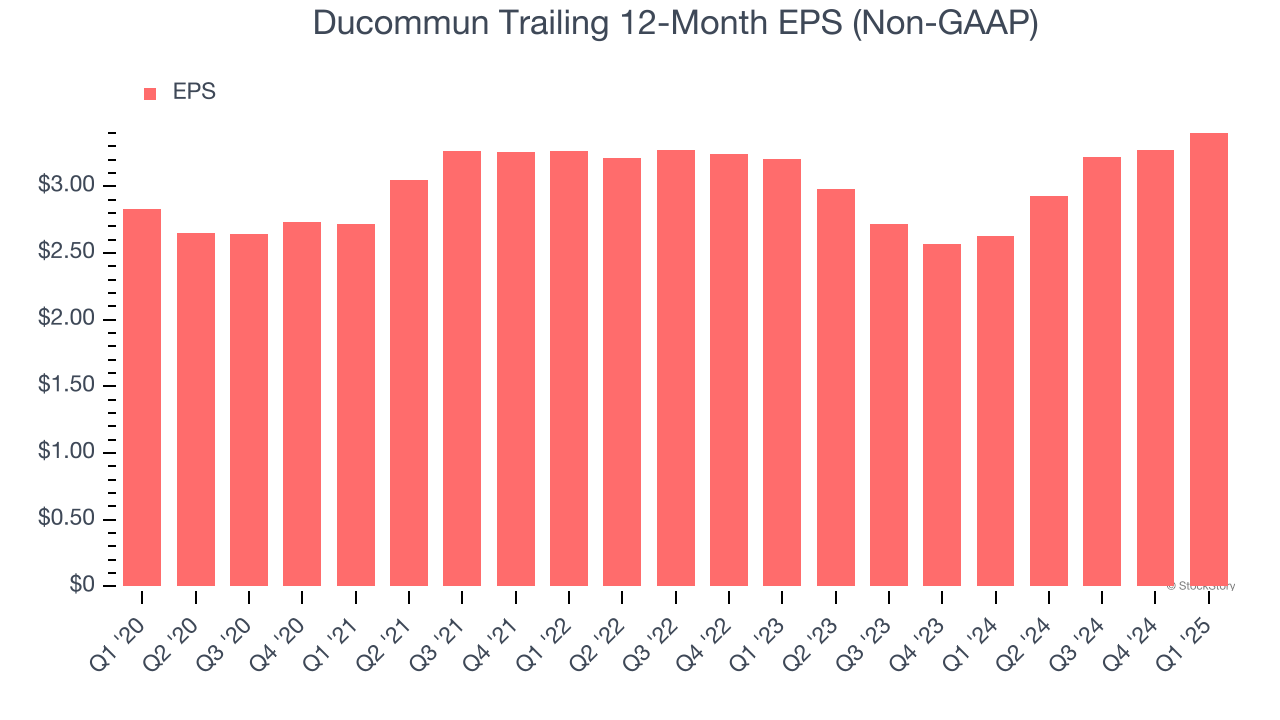
Like with revenue, we analyze EPS over a more recent period because it can provide insight into an emerging theme or development for the business.
For Ducommun, its two-year annual EPS growth of 3.1% is similar to its five-year trend, implying stable earnings.
In Q1, Ducommun reported EPS at $0.83, up from $0.70 in the same quarter last year. This print easily cleared analysts’ estimates, and shareholders should be content with the results. Over the next 12 months, Wall Street expects Ducommun’s full-year EPS of $3.40 to grow 12.5%.
Key Takeaways from Ducommun’s Q1 Results
We were impressed by how significantly Ducommun blew past analysts’ EBITDA expectations this quarter. We were also glad its EPS outperformed Wall Street’s estimates. Zooming out, we think this quarter featured some important positives. The stock remained flat at $58.61 immediately after reporting.
Sure, Ducommun had a solid quarter, but if we look at the bigger picture, is this stock a buy? We think that the latest quarter is only one piece of the longer-term business quality puzzle. Quality, when combined with valuation, can help determine if the stock is a buy. We cover that in our actionable full research report which you can read here, it’s free.