Luxury electric car manufacturer Lucid (NASDAQ: LCID) missed Wall Street’s revenue expectations in Q1 CY2025, but sales rose 36.1% year on year to $235 million. Its non-GAAP loss of $0.20 per share was 14.1% above analysts’ consensus estimates.
Is now the time to buy Lucid? Find out by accessing our full research report, it’s free.
Lucid (LCID) Q1 CY2025 Highlights:
- Revenue: $235 million vs analyst estimates of $237.1 million (36.1% year-on-year growth, 0.9% miss)
- Adjusted EPS: -$0.20 vs analyst estimates of -$0.23 (14.1% beat)
- Adjusted EBITDA: -$563.5 million vs analyst estimates of -$548.3 million (-240% margin, 2.8% miss)
- Operating Margin: -294%, up from -423% in the same quarter last year
- Free Cash Flow was -$589.9 million compared to -$714.9 million in the same quarter last year
- Sales Volumes rose 58.1% year on year (39.9% in the same quarter last year)
- Market Capitalization: $7.19 billion
"We continued to build momentum in the first quarter as we achieved yet another delivery record, further strengthened our market position, and executed against operational priorities," said Marc Winterhoff, Interim CEO at Lucid.
Company Overview
Founded by a former Tesla Vice President, Lucid Group (NASDAQ: LCID) designs, manufactures, and sells luxury electric vehicles with long-range capabilities.
Sales Growth
A company’s long-term performance is an indicator of its overall quality. Even a bad business can shine for one or two quarters, but a top-tier one grows for years. Thankfully, Lucid’s 254% annualized revenue growth over the last four years was incredible. Its growth beat the average industrials company and shows its offerings resonate with customers.
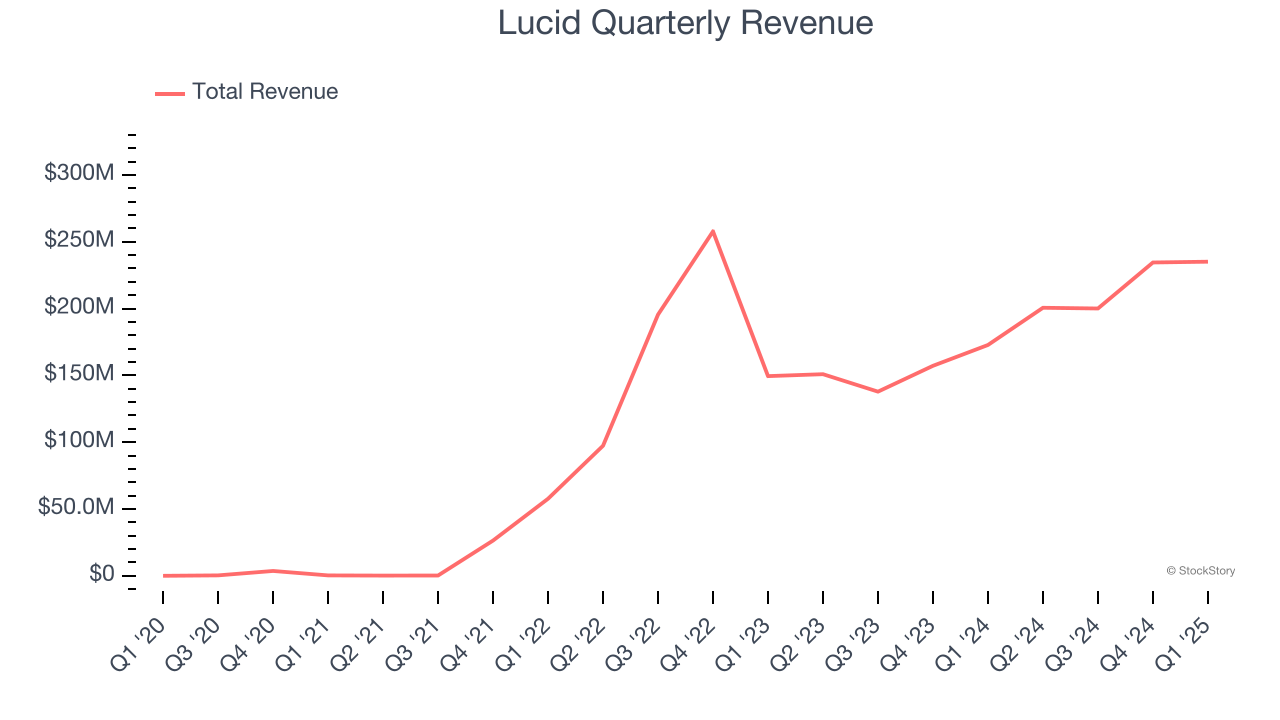
We at StockStory place the most emphasis on long-term growth, but within industrials, a stretched historical view may miss cycles, industry trends, or a company capitalizing on catalysts such as a new contract win or a successful product line. Lucid’s annualized revenue growth of 11.5% over the last two years is below its four-year trend, but we still think the results suggest healthy demand. 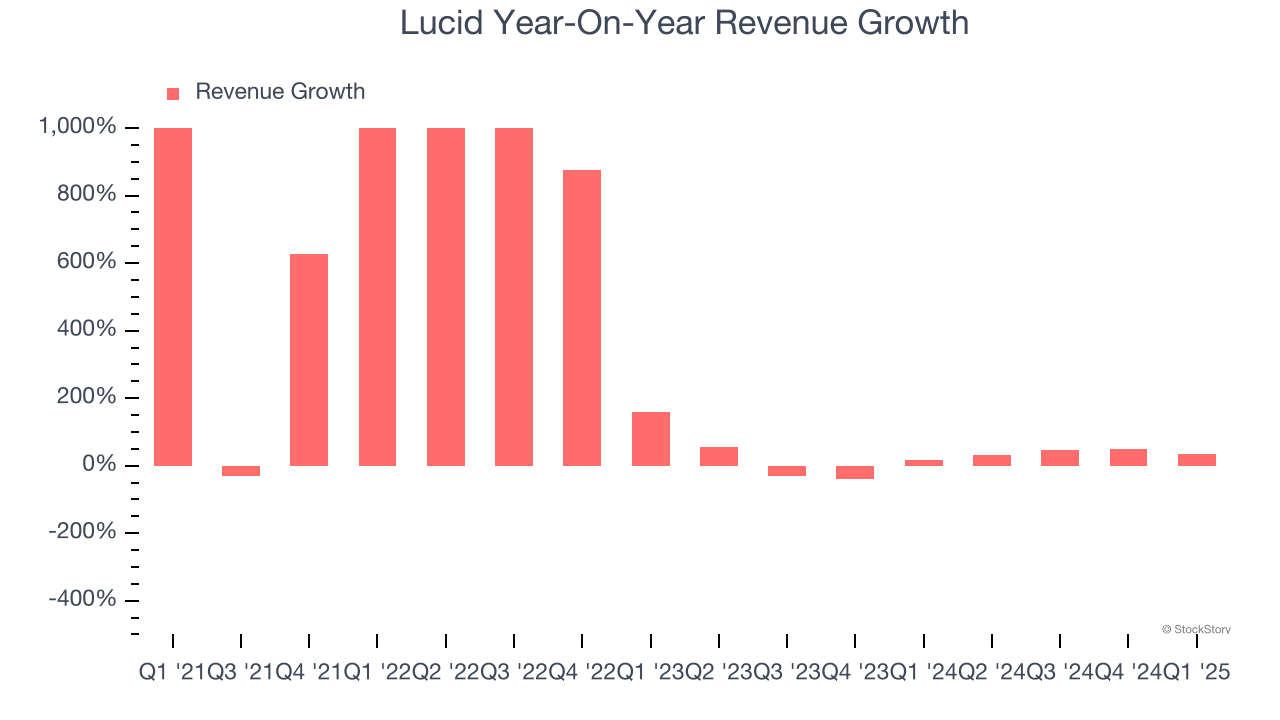
Lucid also reports its number of units sold, which reached 3,109 in the latest quarter. Over the last two years, Lucid’s units sold grew by 45% annually. Because this number is better than its revenue growth, we can see the company’s average selling price decreased. 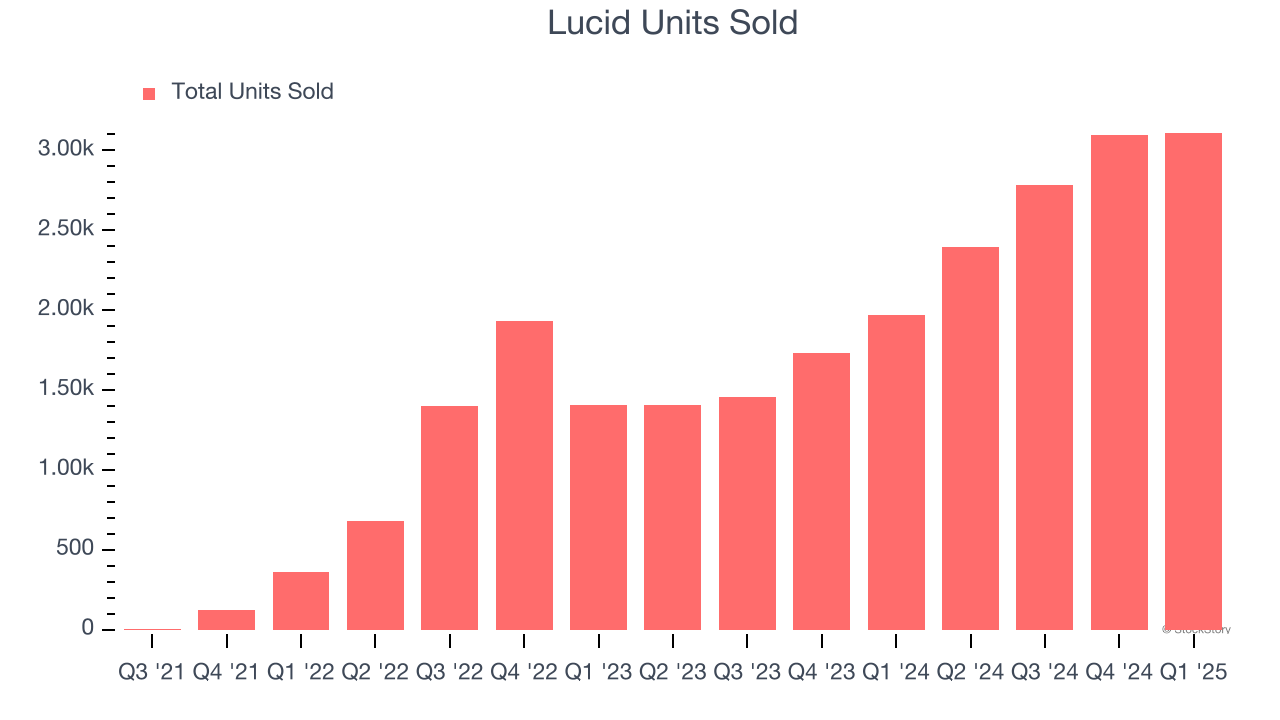
This quarter, Lucid pulled off a wonderful 36.1% year-on-year revenue growth rate, but its $235 million of revenue fell short of Wall Street’s rosy estimates.
Looking ahead, sell-side analysts expect revenue to grow 122% over the next 12 months, an improvement versus the last two years. This projection is eye-popping and suggests its newer products and services will catalyze better top-line performance.
Software is eating the world and there is virtually no industry left that has been untouched by it. That drives increasing demand for tools helping software developers do their jobs, whether it be monitoring critical cloud infrastructure, integrating audio and video functionality, or ensuring smooth content streaming. Click here to access a free report on our 3 favorite stocks to play this generational megatrend.
Operating Margin
Lucid’s high expenses have contributed to an average operating margin of negative 496% over the last five years. Unprofitable industrials companies require extra attention because they could get caught swimming naked when the tide goes out. It’s hard to trust that the business can endure a full cycle.
On the plus side, Lucid’s operating margin rose over the last five years, as its sales growth gave it operating leverage. Still, it will take much more for the company to reach long-term profitability.
This quarter, Lucid generated a negative 294% operating margin. The company's consistent lack of profits raise a flag.
Earnings Per Share
We track the long-term change in earnings per share (EPS) for the same reason as long-term revenue growth. Compared to revenue, however, EPS highlights whether a company’s growth is profitable.
Although Lucid’s full-year earnings are still negative, it reduced its losses and improved its EPS by 66.9% annually over the last four years. The next few quarters will be critical for assessing its long-term profitability. We hope to see an inflection point soon.
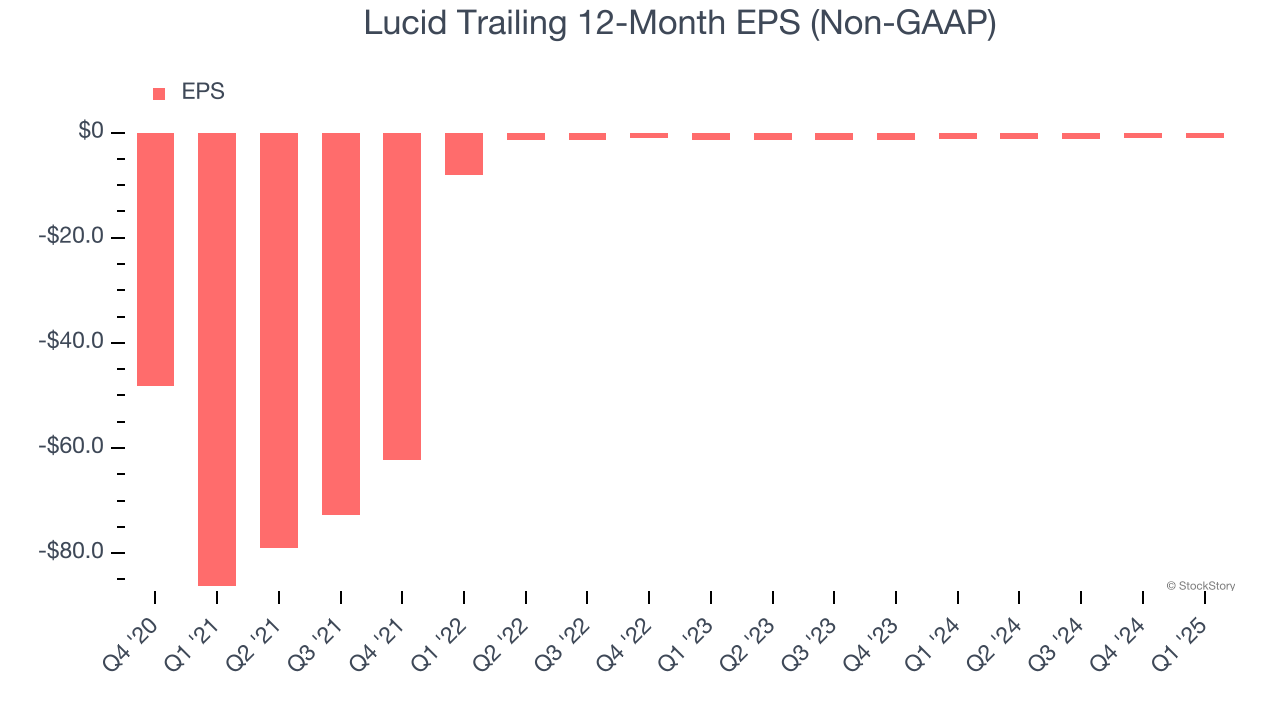
Like with revenue, we analyze EPS over a more recent period because it can provide insight into an emerging theme or development for the business.
For Lucid, its two-year annual EPS growth of 12.3% was lower than its four-year trend. We still think its growth was good and hope it can accelerate in the future.
In Q1, Lucid reported EPS at negative $0.20, up from negative $0.28 in the same quarter last year. This print easily cleared analysts’ estimates, and shareholders should be content with the results. We also like to analyze expected EPS growth based on Wall Street analysts’ consensus projections, but there is insufficient data.
Key Takeaways from Lucid’s Q1 Results
We were impressed by how significantly Lucid blew past analysts’ sales volume and EPS expectations this quarter. On the other hand, its revenue and EBITDA missed, signaling lower average selling prices than anticipated. Overall, this print was mixed but still had some key positives. The stock remained flat at $2.32 immediately following the results.
Indeed, Lucid had a rock-solid quarterly earnings result, but is this stock a good investment here? When making that decision, it’s important to consider its valuation, business qualities, as well as what has happened in the latest quarter. We cover that in our actionable full research report which you can read here, it’s free.