Casual restaurant chain Portillo’s (NASDAQ: PTLO) fell short of the market’s revenue expectations in Q1 CY2025, but sales rose 6.4% year on year to $176.4 million. Its GAAP profit of $0.05 per share was in line with analysts’ consensus estimates.
Is now the time to buy Portillo's? Find out by accessing our full research report, it’s free.
Portillo's (PTLO) Q1 CY2025 Highlights:
- Revenue: $176.4 million vs analyst estimates of $180.7 million (6.4% year-on-year growth, 2.4% miss)
- EPS (GAAP): $0.05 vs analyst estimates of $0.05 (in line)
- Adjusted EBITDA: $21.21 million vs analyst estimates of $22.77 million (12% margin, 6.9% miss)
- Operating Margin: 5.9%, in line with the same quarter last year
- Free Cash Flow was -$9.59 million compared to -$7.86 million in the same quarter last year
- Locations: 94 at quarter end, up from 85 in the same quarter last year
- Same-Store Sales rose 1.8% year on year (-1.2% in the same quarter last year)
- Market Capitalization: $664.6 million
“We’re proud of how our team performed through challenging macro conditions in Q1, driven by the launch of Portillo’s Perks and our marketing efforts,” said Michael Osanloo, President and Chief Executive Officer of Portillo’s.
Company Overview
Begun as a Chicago hot dog stand in 1963, Portillo’s (NASDAQ: PTLO) is a casual restaurant chain that serves Chicago-style hot dogs and beef sandwiches as well as fries and shakes.
Sales Growth
Examining a company’s long-term performance can provide clues about its quality. Even a bad business can shine for one or two quarters, but a top-tier one grows for years.
With $721.2 million in revenue over the past 12 months, Portillo's is a small restaurant chain, which sometimes brings disadvantages compared to larger competitors benefiting from better brand awareness and economies of scale. On the bright side, it can grow faster because it has more white space to build new restaurants.
As you can see below, Portillo’s sales grew at a decent 8.4% compounded annual growth rate over the last five years (we compare to 2019 to normalize for COVID-19 impacts) as it opened new restaurants and increased sales at existing, established dining locations.
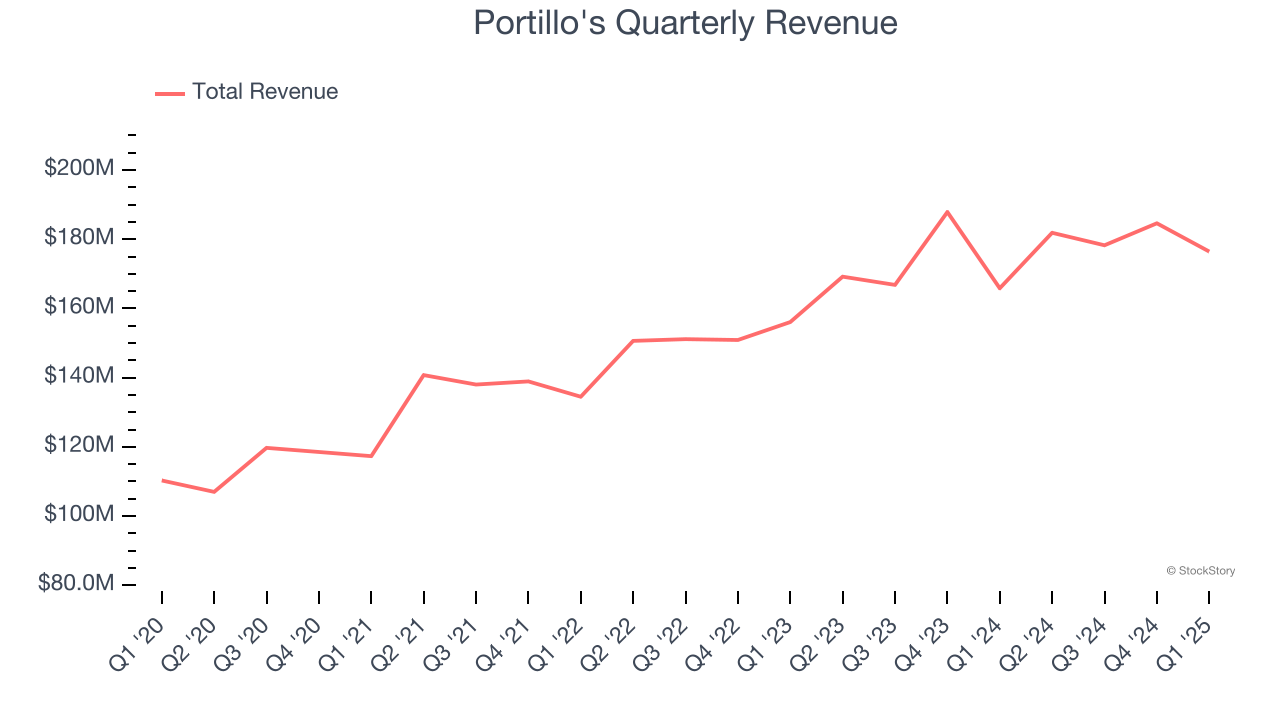
This quarter, Portillo’s revenue grew by 6.4% year on year to $176.4 million, missing Wall Street’s estimates.
Looking ahead, sell-side analysts expect revenue to grow 12.9% over the next 12 months, an acceleration versus the last five years. This projection is noteworthy and suggests its newer menu offerings will catalyze better top-line performance.
Today’s young investors won’t have read the timeless lessons in Gorilla Game: Picking Winners In High Technology because it was written more than 20 years ago when Microsoft and Apple were first establishing their supremacy. But if we apply the same principles, then enterprise software stocks leveraging their own generative AI capabilities may well be the Gorillas of the future. So, in that spirit, we are excited to present our Special Free Report on a profitable, fast-growing enterprise software stock that is already riding the automation wave and looking to catch the generative AI next.
Restaurant Performance
Number of Restaurants
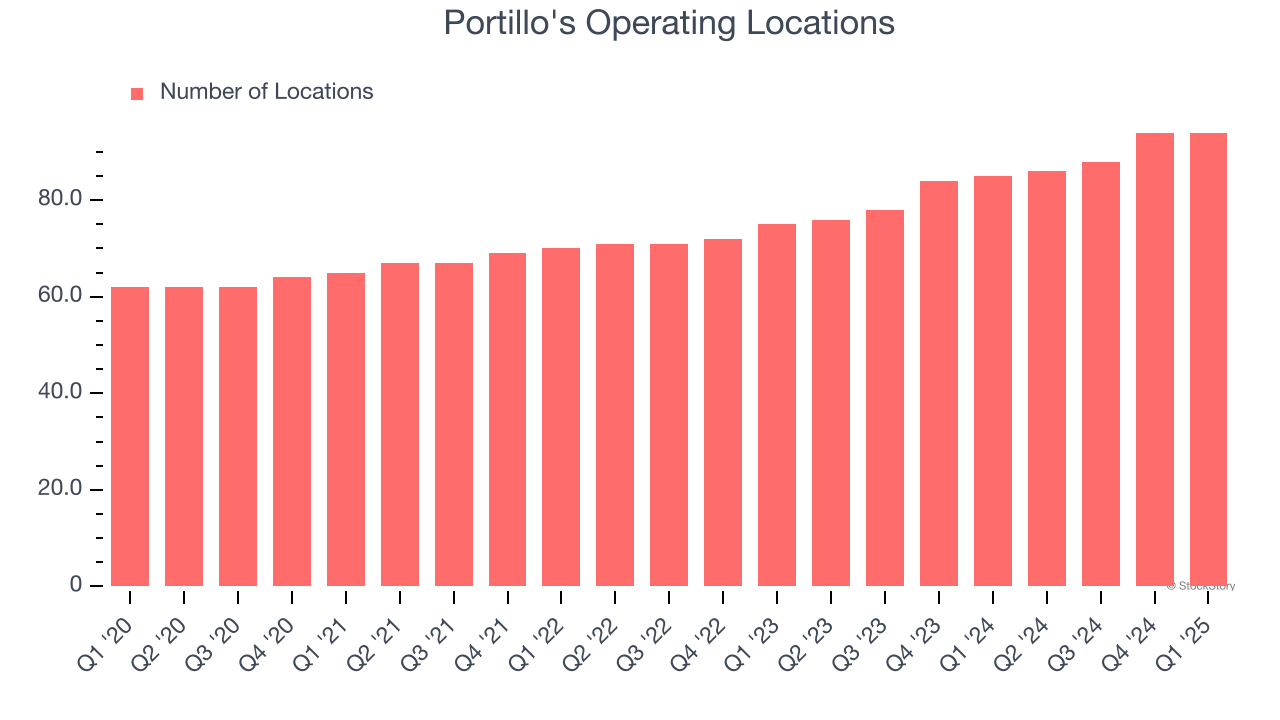
The number of dining locations a restaurant chain operates is a critical driver of how quickly company-level sales can grow.
Portillo's sported 94 locations in the latest quarter. Over the last two years, it has opened new restaurants at a rapid clip by averaging 11.9% annual growth, among the fastest in the restaurant sector. This gives it a chance to scale into a mid-sized business over time.
When a chain opens new restaurants, it usually means it’s investing for growth because there’s healthy demand for its meals and there are markets where its concepts have few or no locations.
Same-Store Sales
The change in a company's restaurant base only tells one side of the story. The other is the performance of its existing locations, which informs management teams whether they should expand or downsize their physical footprints. Same-store sales is an industry measure of whether revenue is growing at those existing restaurants and is driven by customer visits (often called traffic) and the average spending per customer (ticket).
Portillo’s demand within its existing dining locations has been relatively stable over the last two years but was below most restaurant chains. On average, the company’s same-store sales have grown by 1.7% per year. This performance suggests it should consider improving its foot traffic and efficiency before expanding its restaurant base.
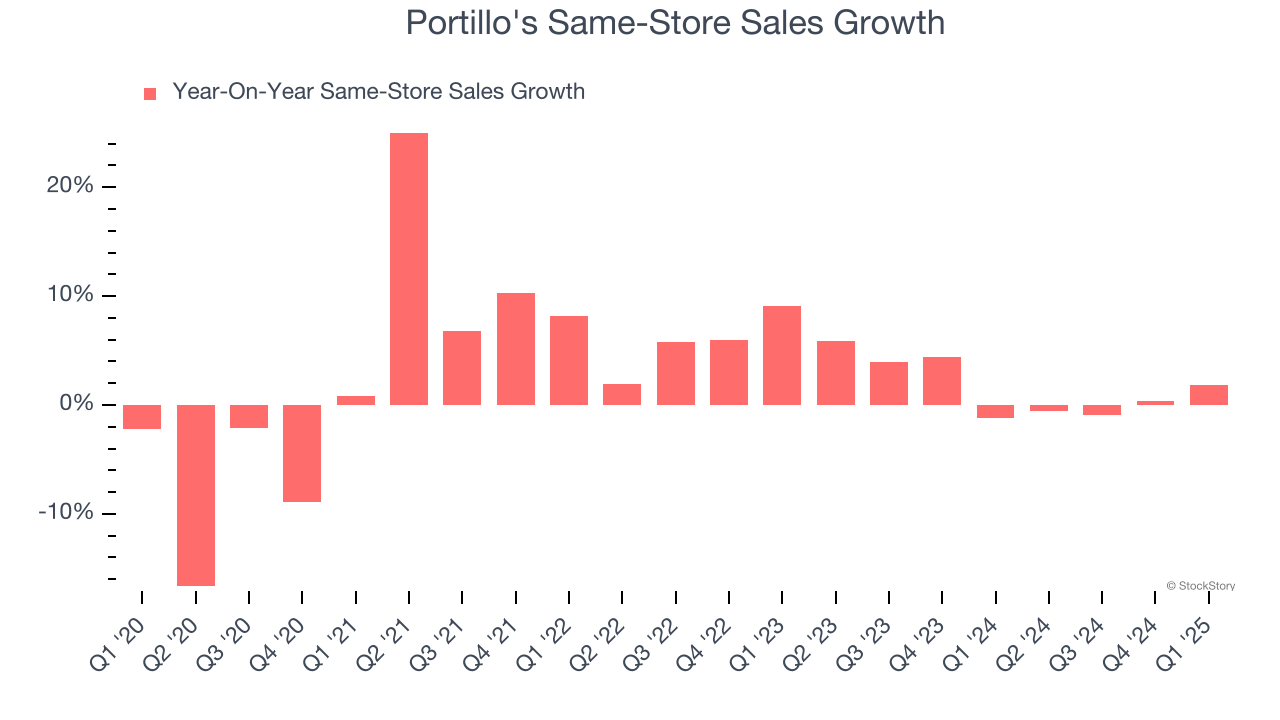
In the latest quarter, Portillo’s same-store sales rose 1.8% year on year. This performance was more or less in line with its historical levels.
Key Takeaways from Portillo’s Q1 Results
We were impressed by how significantly Portillo's blew past analysts’ same-store sales expectations this quarter. On the other hand, its revenue and EBITDA fell short of Wall Street’s estimates. Overall, this quarter could have been better. The stock traded down 6.7% to $9.70 immediately after reporting.
Portillo's underperformed this quarter, but does that create an opportunity to invest right now? The latest quarter does matter, but not nearly as much as longer-term fundamentals and valuation, when deciding if the stock is a buy. We cover that in our actionable full research report which you can read here, it’s free.