Casual restaurant chain Dine Brands (NYSE: DIN) met Wall Street’s revenue expectations in Q1 CY2025, with sales up 4.1% year on year to $214.8 million. Its non-GAAP profit of $1.03 per share was 16.7% below analysts’ consensus estimates.
Is now the time to buy Dine Brands? Find out by accessing our full research report, it’s free.
Dine Brands (DIN) Q1 CY2025 Highlights:
- Revenue: $214.8 million vs analyst estimates of $215.1 million (4.1% year-on-year growth, in line)
- Adjusted EPS: $1.03 vs analyst expectations of $1.24 (16.7% miss)
- Adjusted EBITDA: $54.73 million vs analyst estimates of $57.31 million (25.5% margin, 4.5% miss)
- EBITDA guidance for the full year is $240 million at the midpoint, above analyst estimates of $235.4 million
- Operating Margin: 18.1%, down from 21.9% in the same quarter last year
- Free Cash Flow Margin: 6.8%, down from 13.2% in the same quarter last year
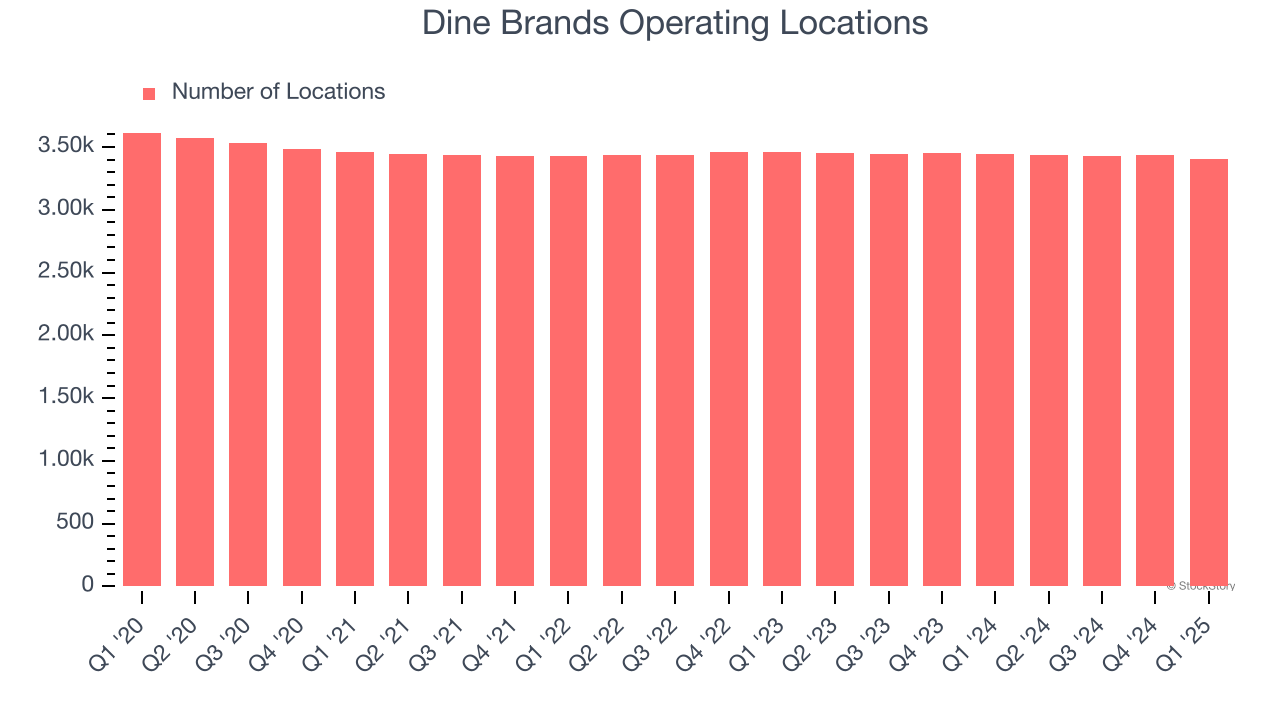
- Locations: 3,408 at quarter end, down from 3,445 in the same quarter last year
- Market Capitalization: $312.3 million
"As we navigate the current operating environment, the fundamentals of our business remain strong, and since the second half of the quarter, we’re seeing steady improvement across sales, traffic, and our development pipeline," said John Peyton, Chief Executive Officer of Dine Brands Global
Company Overview
Operating a franchise model, Dine Brands (NYSE: DIN) is a casual restaurant chain that owns the Applebee’s and IHOP banners.
Sales Growth
A company’s long-term sales performance is one signal of its overall quality. Even a bad business can shine for one or two quarters, but a top-tier one grows for years.
With $820.9 million in revenue over the past 12 months, Dine Brands is a small restaurant chain, which sometimes brings disadvantages compared to larger competitors benefiting from better brand awareness and economies of scale.
As you can see below, Dine Brands struggled to increase demand as its $820.9 million of sales for the trailing 12 months was close to its revenue six years ago (we compare to 2019 to normalize for COVID-19 impacts). This was mainly because it didn’t open many new restaurants and observed lower sales at existing, established dining locations.
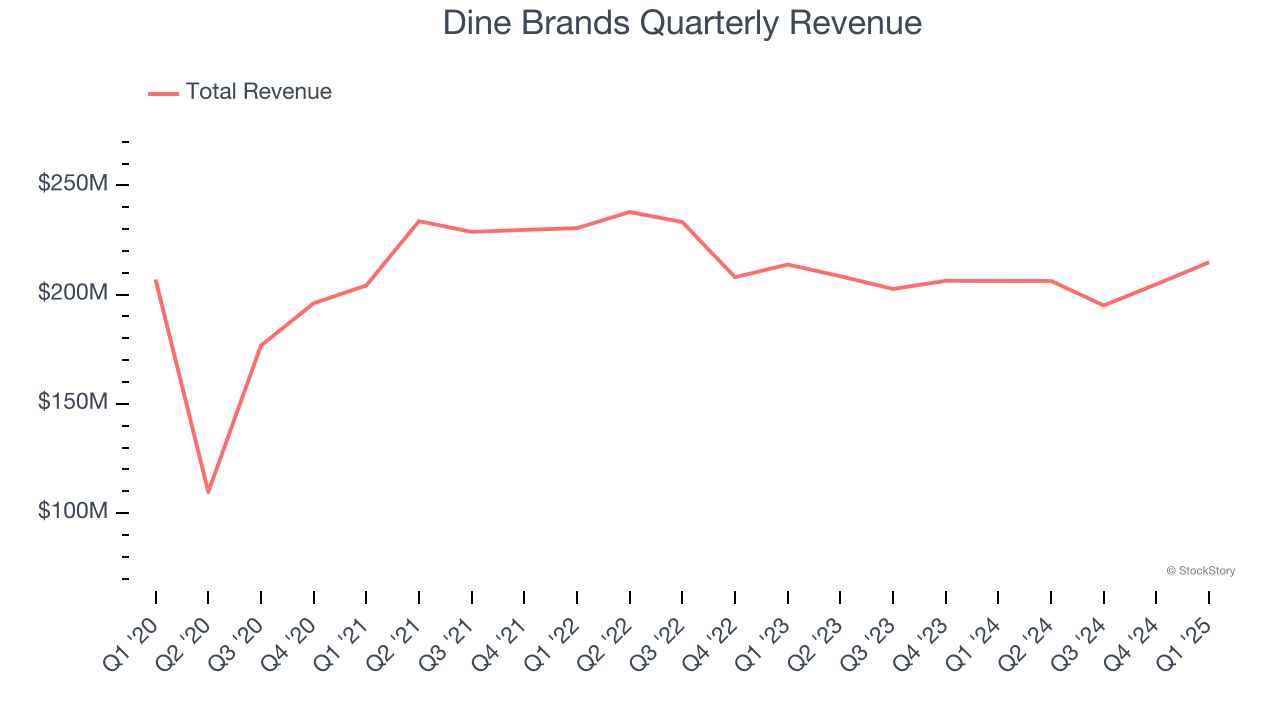
This quarter, Dine Brands grew its revenue by 4.1% year on year, and its $214.8 million of revenue was in line with Wall Street’s estimates.
Looking ahead, sell-side analysts expect revenue to grow 4.7% over the next 12 months. While this projection implies its newer menu offerings will fuel better top-line performance, it is still below the sector average.
Here at StockStory, we certainly understand the potential of thematic investing. Diverse winners from Microsoft (MSFT) to Alphabet (GOOG), Coca-Cola (KO) to Monster Beverage (MNST) could all have been identified as promising growth stories with a megatrend driving the growth. So, in that spirit, we’ve identified a relatively under-the-radar profitable growth stock benefiting from the rise of AI, available to you FREE via this link.
Restaurant Performance
Number of Restaurants
The number of dining locations a restaurant chain operates is a critical driver of how quickly company-level sales can grow.
Dine Brands listed 3,408 locations in the latest quarter and has kept its restaurant count flat over the last two years while other restaurant businesses have opted for growth.
When a chain doesn’t open many new restaurants, it usually means there’s stable demand for its meals and it’s focused on improving operational efficiency to increase profitability.
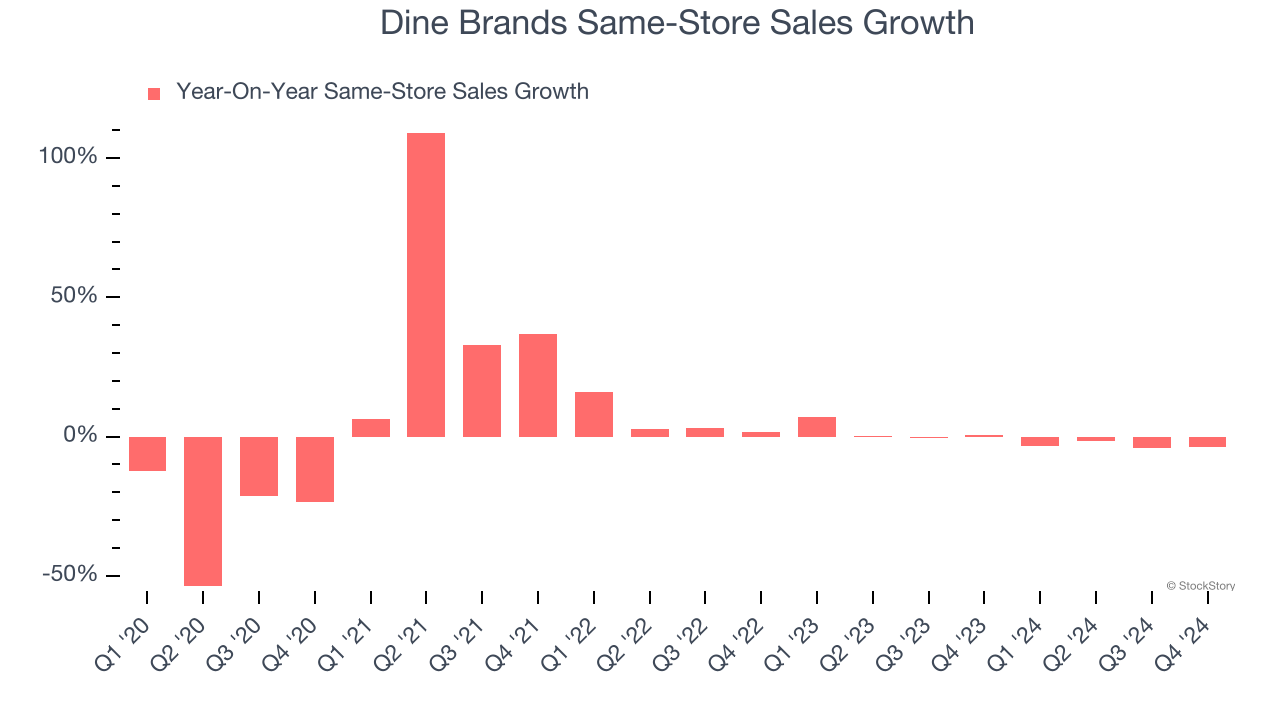
Same-Store Sales
A company's restaurant base only paints one part of the picture. When demand is high, it makes sense to open more. But when demand is low, it’s prudent to close some locations and use the money in other ways. Same-store sales provides a deeper understanding of this issue because it measures organic growth at restaurants open for at least a year.
Dine Brands’s demand has been shrinking over the last two years as its same-store sales have averaged 1.8% annual declines. This performance isn’t ideal, and we’d be concerned if Dine Brands starts opening new restaurants to artificially boost revenue growth.
Note that Dine Brands reports its same-store sales intermittently, so some data points are missing in the chart below.
Key Takeaways from Dine Brands’s Q1 Results
It was encouraging to see Dine Brands’s full-year EBITDA guidance beat analysts’ expectations. On the other hand, both its EBITDA and EPS fell short of Wall Street’s estimates due to weaker profitability, as revenue was in line. Overall, this was a mixed quarter. The stock remained flat at $19.95 immediately following the results.
Dine Brands’s earnings report left more to be desired. Let’s look forward to see if this quarter has created an opportunity to buy the stock. When making that decision, it’s important to consider its valuation, business qualities, as well as what has happened in the latest quarter. We cover that in our actionable full research report which you can read here, it’s free.