Leading edge card issuer Marqeta (NASDAQ: MQ) reported revenue ahead of Wall Street’s expectations in Q1 CY2025, with sales up 17.9% year on year to $139.1 million. On the other hand, next quarter’s revenue guidance of $140.3 million was less impressive, coming in 3.8% below analysts’ estimates. Its non-GAAP loss of $0.02 per share was $0.03 above analysts’ consensus estimates.
Is now the time to buy Marqeta? Find out by accessing our full research report, it’s free.
Marqeta (MQ) Q1 CY2025 Highlights:
- Revenue: $139.1 million vs analyst estimates of $135.8 million (17.9% year-on-year growth, 2.4% beat)
- Adjusted EPS: -$0.02 vs analyst estimates of -$0.05 ($0.03 beat)
- Adjusted EBITDA: $20.08 million vs analyst estimates of $14.09 million (14.4% margin, 42.5% beat)
- Revenue Guidance for Q2 CY2025 is $140.3 million at the midpoint, below analyst estimates of $145.8 million
- Operating Margin: -13.3%, up from -42.3% in the same quarter last year
- Free Cash Flow Margin: 1.9%, down from 18.2% in the previous quarter
- Market Capitalization: $1.83 billion
Company Overview
Founded by CEO Jason Gardner in 2009, Marqeta (NASDAQ: MQ) is an innovative card issuer that provides companies with the ability to issue and process virtual, physical, and tokenized credit and debit cards.
Sales Growth
A company’s long-term performance is an indicator of its overall quality. Any business can have short-term success, but a top-tier one grows for years. Over the last three years, Marqeta’s demand was weak and its revenue declined by 2.8% per year. This was below our standards and is a rough starting point for our analysis.
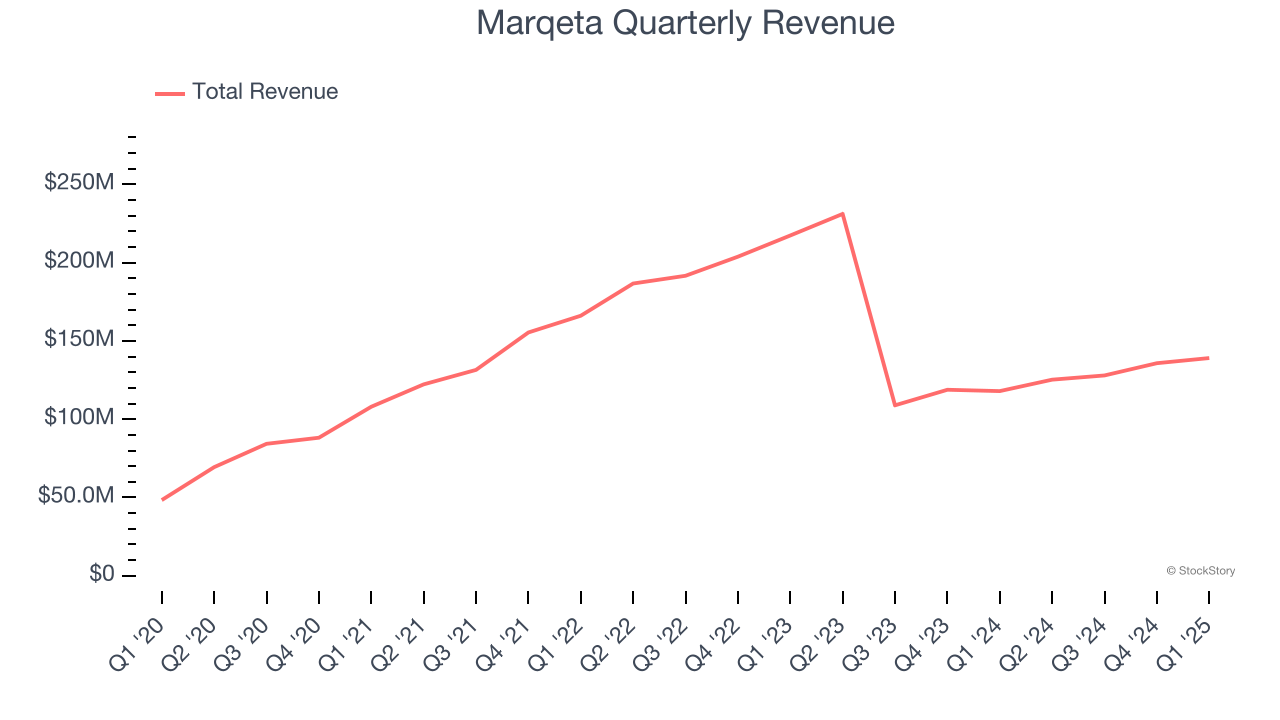
This quarter, Marqeta reported year-on-year revenue growth of 17.9%, and its $139.1 million of revenue exceeded Wall Street’s estimates by 2.4%. Company management is currently guiding for a 12% year-on-year increase in sales next quarter.
Looking further ahead, sell-side analysts expect revenue to grow 16.8% over the next 12 months, an acceleration versus the last three years. This projection is commendable and suggests its newer products and services will catalyze better top-line performance.
Here at StockStory, we certainly understand the potential of thematic investing. Diverse winners from Microsoft (MSFT) to Alphabet (GOOG), Coca-Cola (KO) to Monster Beverage (MNST) could all have been identified as promising growth stories with a megatrend driving the growth. So, in that spirit, we’ve identified a relatively under-the-radar profitable growth stock benefiting from the rise of AI, available to you FREE via this link.
Total Payment Volume
TPV, or total processing volume, is the aggregate dollar value of transactions flowing through Marqeta’s platform. This is the number from which the company will ultimately collect fees, and the higher it is, the more chances Marqeta has to upsell additional services (like banking).
Marqeta’s TPV punched in at $84.47 billion in Q1, and over the last four quarters, its growth was fantastic as it averaged 29.5% year-on-year increases. This alternate topline metric grew faster than total sales, which could mean that take rates have declined. However, we can’t automatically assume the company is reducing its fees because take rates can also vary depending on the type of products sold on its platform. 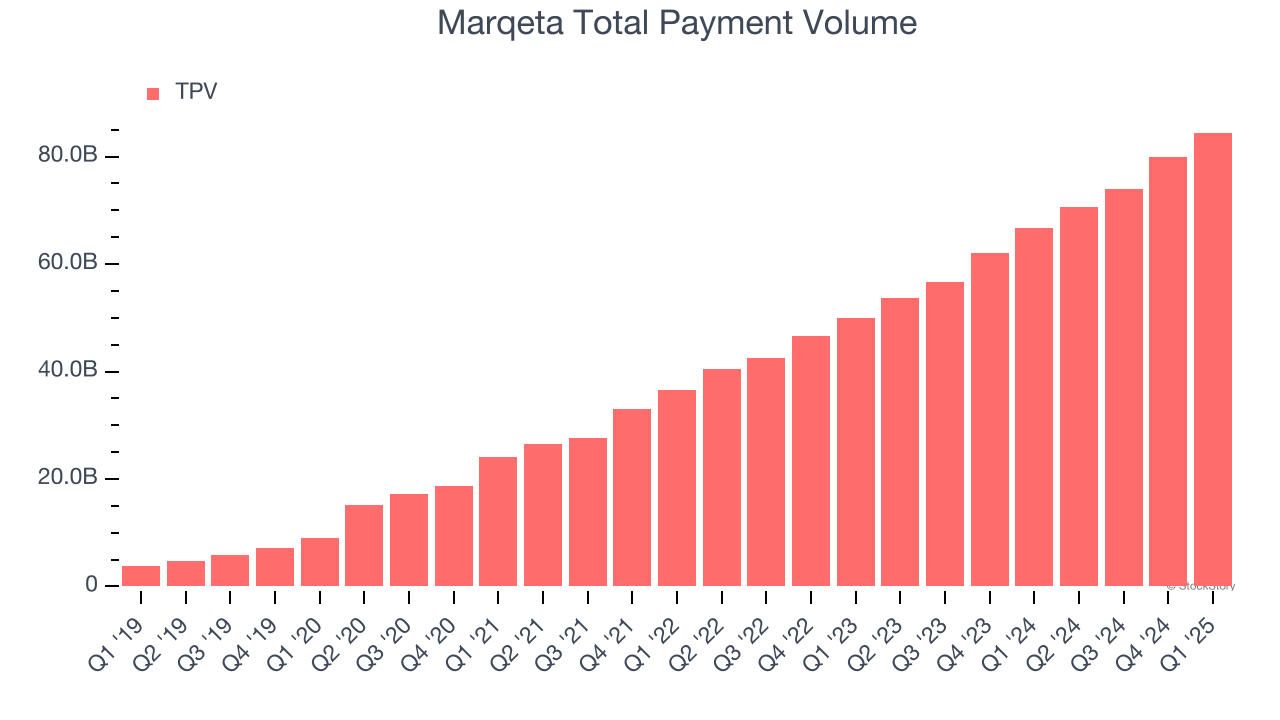
Customer Acquisition Efficiency
The customer acquisition cost (CAC) payback period represents the months required to recover the cost of acquiring a new customer. Essentially, it’s the break-even point for sales and marketing investments. A shorter CAC payback period is ideal, as it implies better returns on investment and business scalability.
Marqeta is extremely efficient at acquiring new customers, and its CAC payback period checked in at 0.8 months this quarter. The company’s rapid recovery of its customer acquisition costs indicates it has a highly differentiated product offering and a strong brand reputation. These dynamics give Marqeta more resources to pursue new product initiatives while maintaining the flexibility to increase its sales and marketing investments.
Key Takeaways from Marqeta’s Q1 Results
We were impressed by how significantly Marqeta blew past analysts’ EBITDA expectations this quarter. We were also happy its total payment volume narrowly outperformed Wall Street’s estimates. On the other hand, its revenue guidance for next quarter missed significantly. Overall, this print was still decent. The stock traded up 2.6% to $4.20 immediately following the results.
Is Marqeta an attractive investment opportunity at the current price? The latest quarter does matter, but not nearly as much as longer-term fundamentals and valuation, when deciding if the stock is a buy. We cover that in our actionable full research report which you can read here, it’s free.