Veeva Systems currently trades at $238.50 per share and has shown little upside over the past six months, posting a middling return of 1.5%. However, the stock is beating the S&P 500’s 6.2% decline during that period.
Given the relative strength, is there still a buying opportunity in VEEV? Or is the market overestimating its value? Find out in our full research report, it’s free.
Why Does VEEV Stock Spark Debate?
Built on top of Salesforce as one of the first vertical-focused cloud platforms, Veeva (NYSE: VEEV) provides data and customer relationship management (CRM) software for organizations in the life sciences industry.
Two Things to Like:
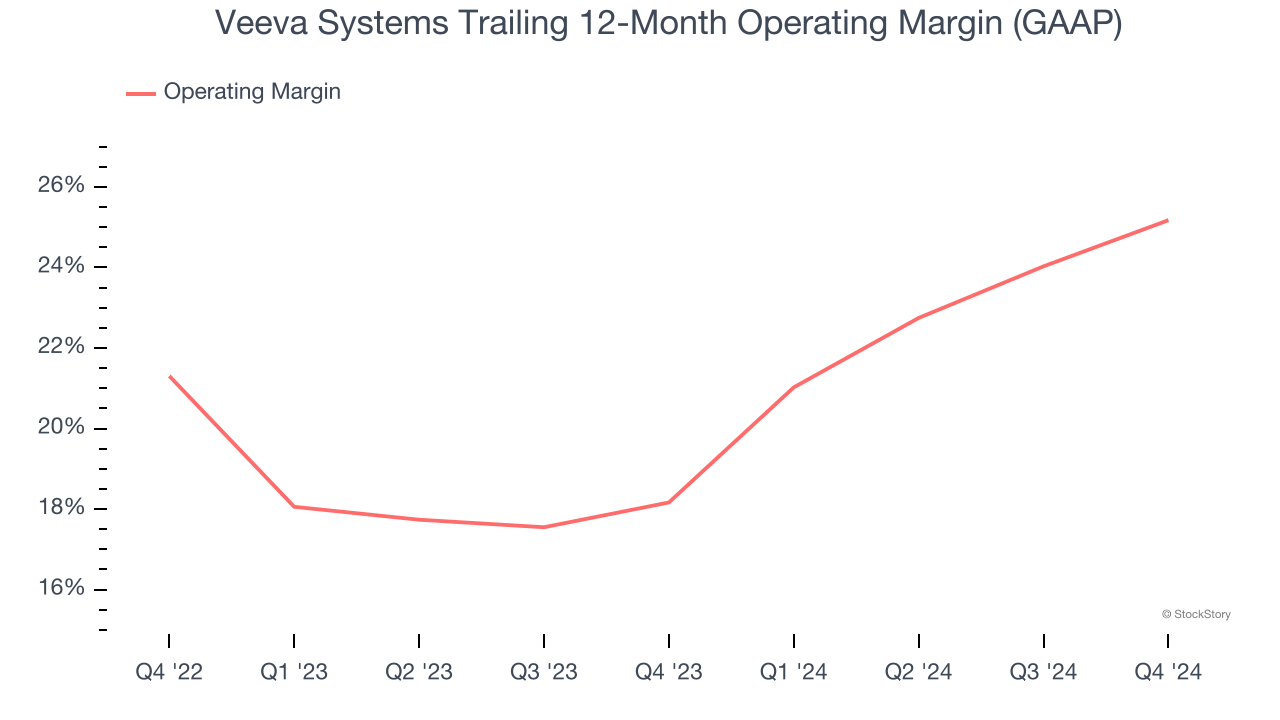
1. Operating Margin Reveals a Well-Run Organization
Many software businesses adjust their profits for stock-based compensation (SBC), but we prioritize GAAP operating margin because SBC is a real expense used to attract and retain engineering and sales talent. This is one of the best measures of profitability because it shows how much money a company takes home after developing, marketing, and selling its products.
Veeva Systems has been a well-oiled machine over the last year. It demonstrated elite profitability for a software business, boasting an average operating margin of 25.2%. This result isn’t too surprising as its gross margin gives it a favorable starting point.
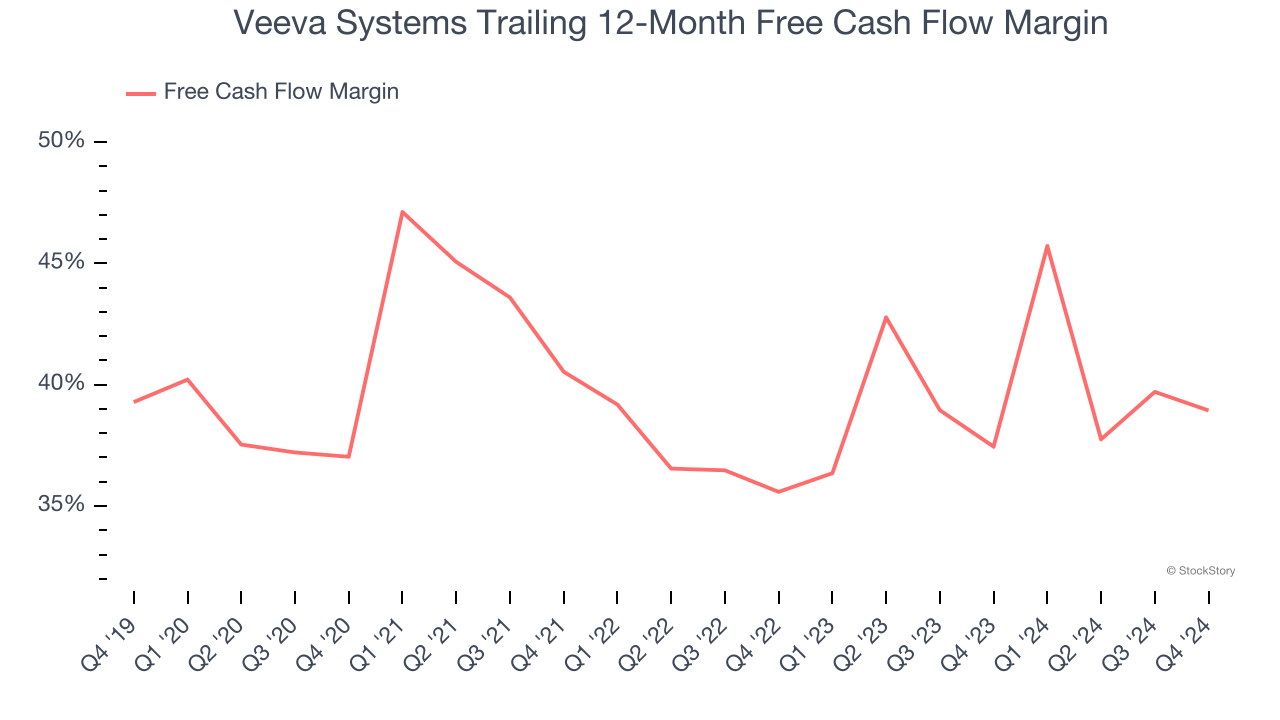
2. Excellent Free Cash Flow Margin Boosts Reinvestment Potential
Free cash flow isn't a prominently featured metric in company financials and earnings releases, but we think it's telling because it accounts for all operating and capital expenses, making it tough to manipulate. Cash is king.
Veeva Systems has shown terrific cash profitability, driven by its lucrative business model and cost-effective customer acquisition strategy that enable it to stay ahead of the competition through investments in new products rather than sales and marketing. The company’s free cash flow margin was among the best in the software sector, averaging an eye-popping 38.9% over the last year.
One Reason to be Careful:
Long-Term Revenue Growth Disappoints
A company’s long-term sales performance is one signal of its overall quality. Any business can put up a good quarter or two, but many enduring ones grow for years. Over the last three years, Veeva Systems grew its sales at a 14.1% annual rate. Although this growth is acceptable on an absolute basis, it fell short of our standards for the software sector, which enjoys a number of secular tailwinds. Luckily, there are other things to like about Veeva Systems. 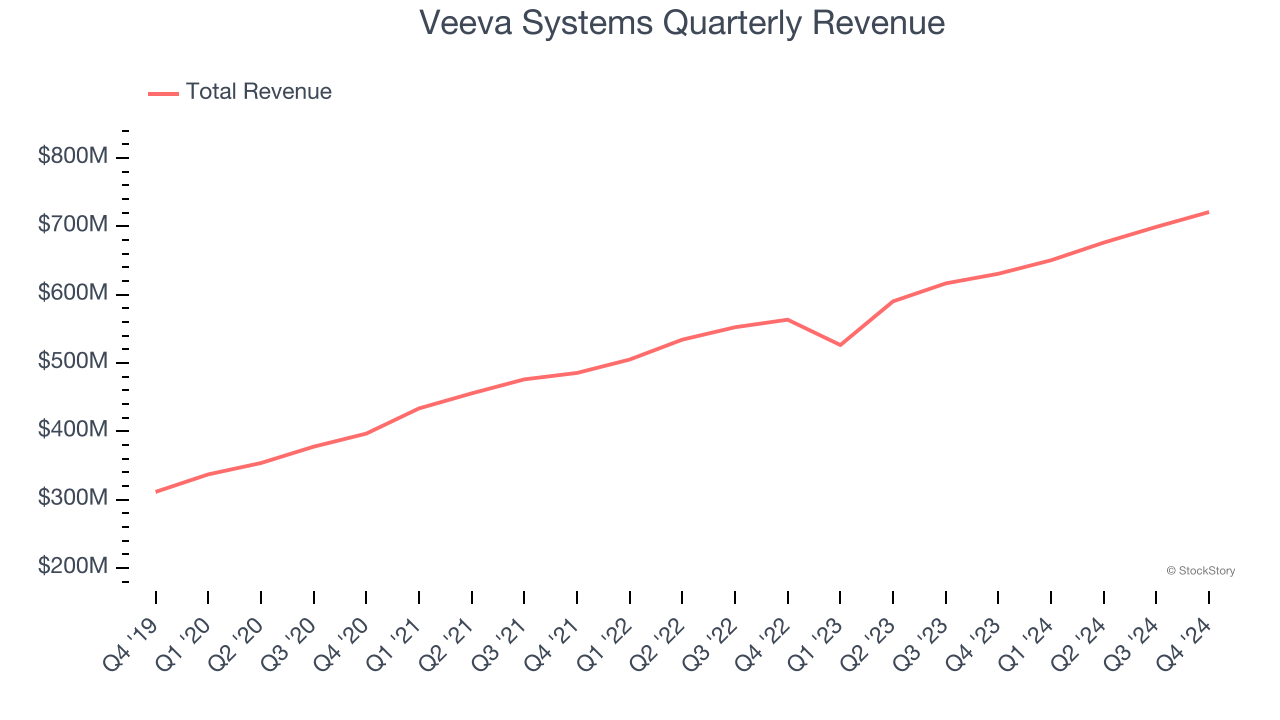
Final Judgment
Veeva Systems’s merits more than compensate for its flaws, and with its recent outperformance in a weaker market environment, the stock trades at 13× forward price-to-sales (or $238.50 per share). Is now a good time to buy? See for yourself in our in-depth research report, it’s free.
Stocks That Overcame Trump’s 2018 Tariffs
Donald Trump’s victory in the 2024 U.S. Presidential Election sent major indices to all-time highs, but stocks have retraced as investors debate the health of the economy and the potential impact of tariffs.
While this leaves much uncertainty around 2025, a few companies are poised for long-term gains regardless of the political or macroeconomic climate, like our Top 9 Market-Beating Stocks. This is a curated list of our High Quality stocks that have generated a market-beating return of 175% over the last five years.
Stocks that made our list in 2019 include now familiar names such as Nvidia (+2,183% between December 2019 and December 2024) as well as under-the-radar businesses like Sterling Infrastructure (+1,096% five-year return). Find your next big winner with StockStory today.


