
Real estate technology company The Real Brokerage (NASDAQ: REAX) announced better-than-expected revenue in Q1 CY2025, with sales up 76.3% year on year to $354 million. Its GAAP loss of $0.02 per share was $0.02 above analysts’ consensus estimates.
Is now the time to buy The Real Brokerage? Find out by accessing our full research report, it’s free.
The Real Brokerage (REAX) Q1 CY2025 Highlights:
- Revenue: $354 million vs analyst estimates of $332.9 million (76.3% year-on-year growth, 6.3% beat)
- EPS (GAAP): -$0.02 vs analyst estimates of -$0.05 ($0.02 beat)
- Adjusted EBITDA: $8.28 million vs analyst estimates of $5.81 million (2.3% margin, 42.4% beat)
- Operating Margin: -1.5%, up from -3.2% in the same quarter last year
- Free Cash Flow Margin: 4.4%, down from 10.7% in the same quarter last year
- Market Capitalization: $917.6 million
“Real delivered outstanding results to start 2025, continuing our track record of differentiated growth,” said Tamir Poleg, Real’s Chairman and Chief Executive Officer.
Company Overview
Founded in Toronto, Canada in 2014, The Real Brokerage (NASDAQ: REAX) is a technology-driven real estate brokerage firm combining a tech-centric model with an agent-centric philosophy.
Sales Growth
A company’s long-term performance is an indicator of its overall quality. Even a bad business can shine for one or two quarters, but a top-tier one grows for years. Luckily, The Real Brokerage’s sales grew at an incredible 152% compounded annual growth rate over the last five years. Its growth beat the average consumer discretionary company and shows its offerings resonate with customers.
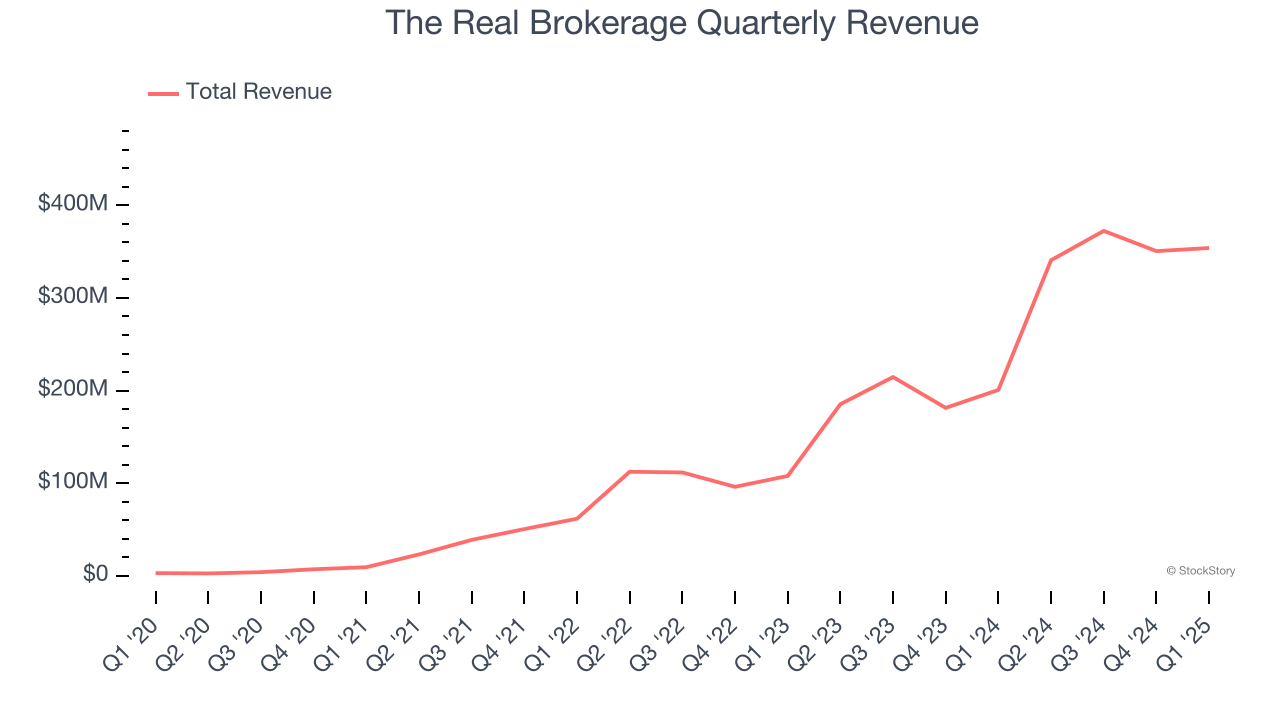
Long-term growth is the most important, but within consumer discretionary, product cycles are short and revenue can be hit-driven due to rapidly changing trends and consumer preferences. The Real Brokerage’s annualized revenue growth of 82% over the last two years is below its five-year trend, but we still think the results suggest healthy demand. 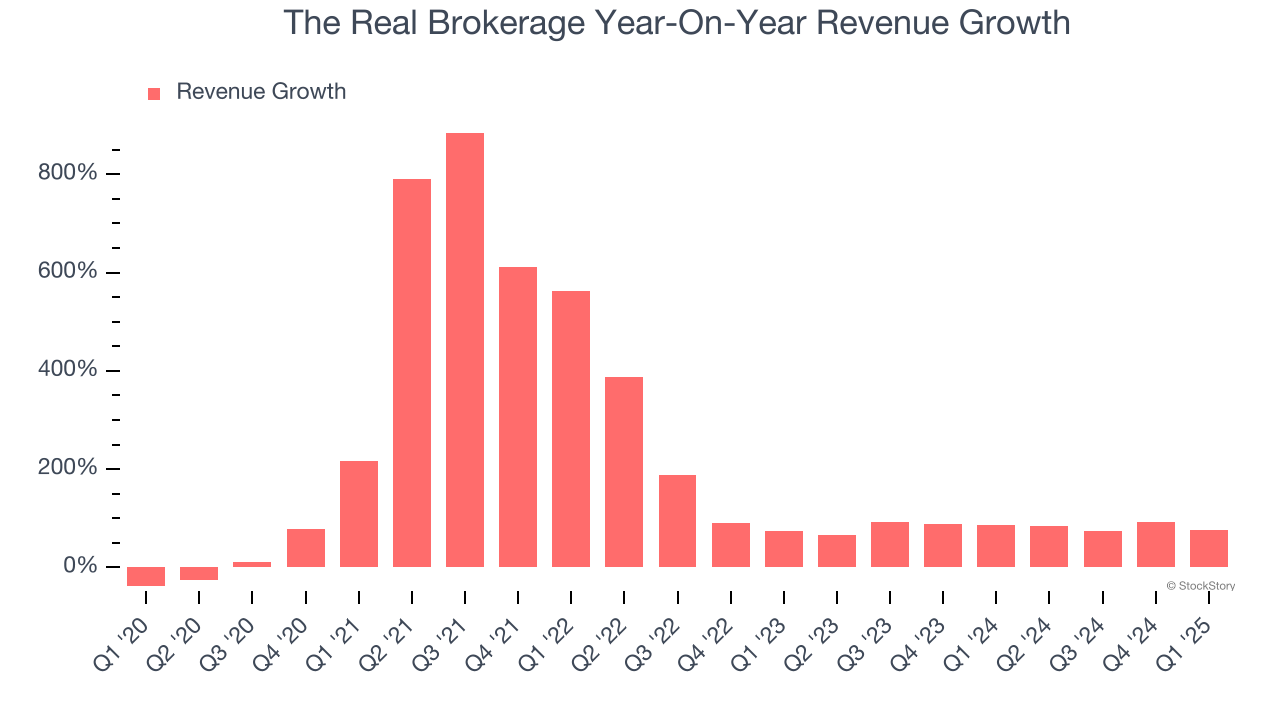
This quarter, The Real Brokerage reported magnificent year-on-year revenue growth of 76.3%, and its $354 million of revenue beat Wall Street’s estimates by 6.3%.
Looking ahead, sell-side analysts expect revenue to grow 24.8% over the next 12 months, a deceleration versus the last two years. Still, this projection is healthy and indicates the market is forecasting success for its products and services.
Today’s young investors won’t have read the timeless lessons in Gorilla Game: Picking Winners In High Technology because it was written more than 20 years ago when Microsoft and Apple were first establishing their supremacy. But if we apply the same principles, then enterprise software stocks leveraging their own generative AI capabilities may well be the Gorillas of the future. So, in that spirit, we are excited to present our Special Free Report on a profitable, fast-growing enterprise software stock that is already riding the automation wave and looking to catch the generative AI next.
Operating Margin
Operating margin is a key measure of profitability. Think of it as net income - the bottom line - excluding the impact of taxes and interest on debt, which are less connected to business fundamentals.
The Real Brokerage’s operating margin has risen over the last 12 months, but it still averaged negative 1.8% over the last two years. This is due to its large expense base and inefficient cost structure.
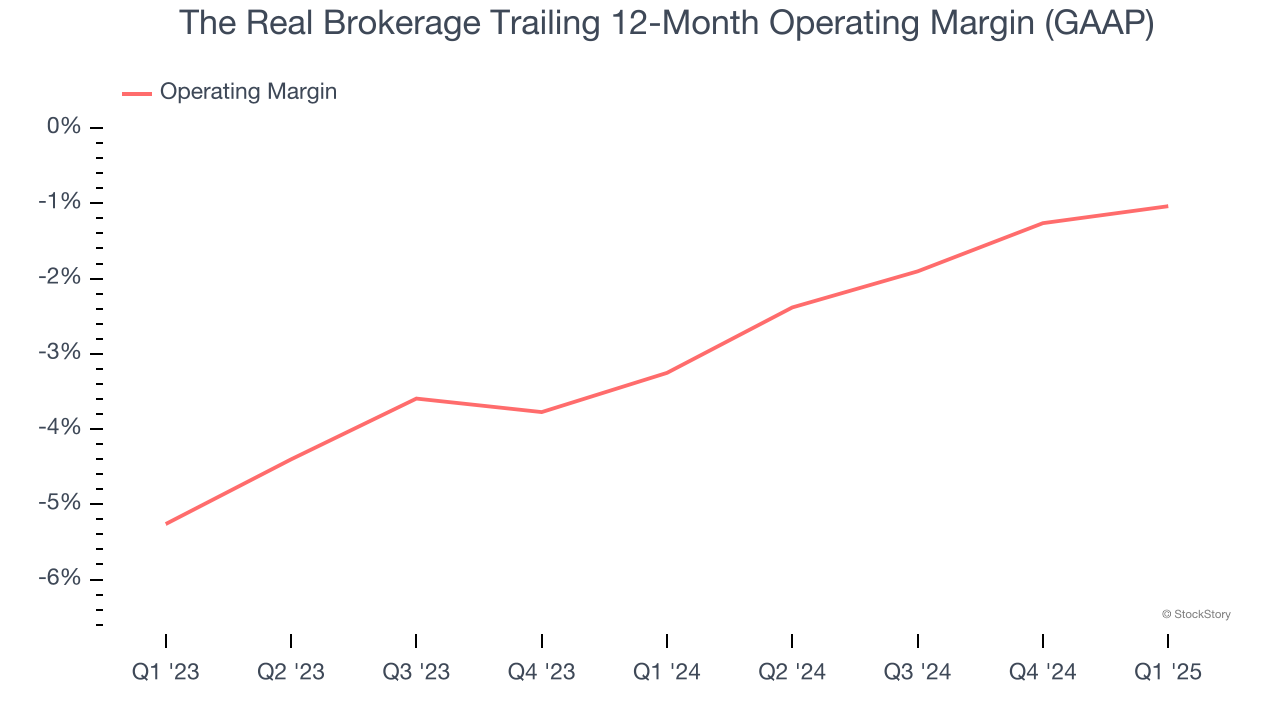
In Q1, The Real Brokerage generated a negative 1.5% operating margin. The company's consistent lack of profits raise a flag.
Earnings Per Share
We track the long-term change in earnings per share (EPS) for the same reason as long-term revenue growth. Compared to revenue, however, EPS highlights whether a company’s growth is profitable.
The Real Brokerage’s earnings losses deepened over the last five years as its EPS dropped 9% annually. We tend to steer our readers away from companies with falling EPS, where diminishing earnings could imply changing secular trends and preferences. Consumer Discretionary companies are particularly exposed to this, and if the tide turns unexpectedly, The Real Brokerage’s low margin of safety could leave its stock price susceptible to large downswings.
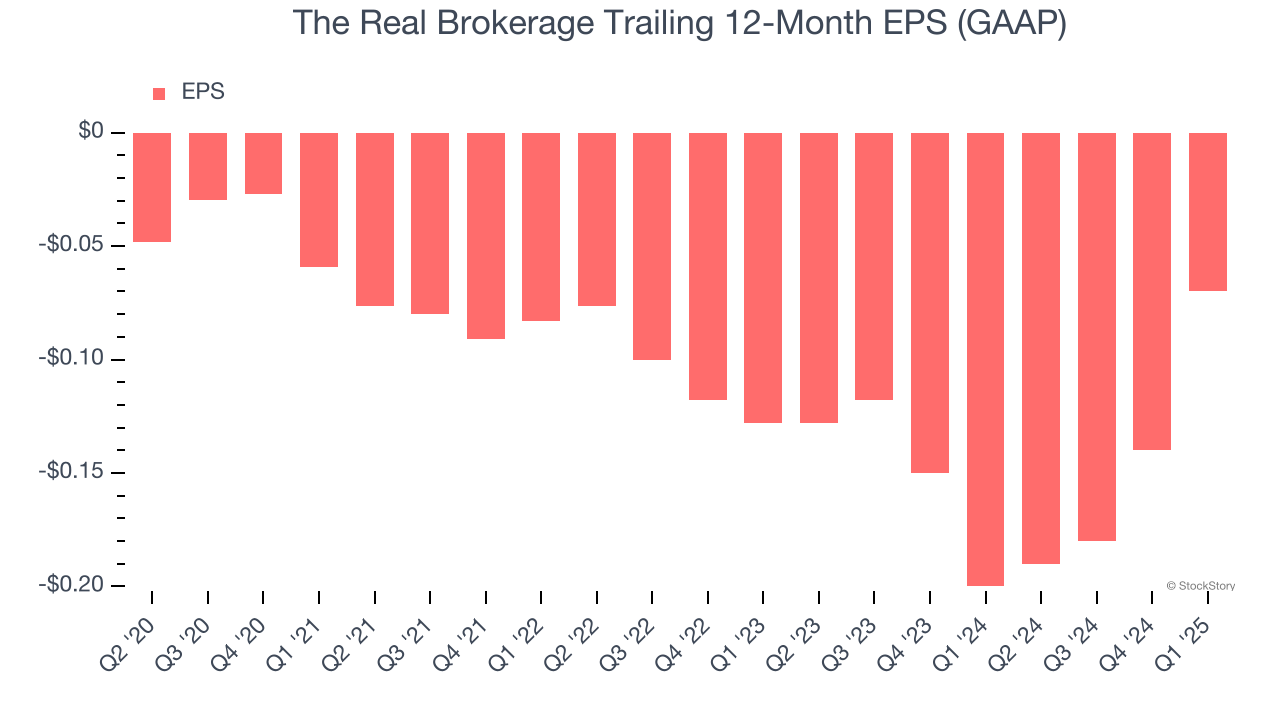
In Q1, The Real Brokerage reported EPS at negative $0.02, up from negative $0.09 in the same quarter last year. This print easily cleared analysts’ estimates, and shareholders should be content with the results. Over the next 12 months, Wall Street is optimistic. Analysts forecast The Real Brokerage’s full-year EPS of negative $0.07 will reach break even.
Key Takeaways from The Real Brokerage’s Q1 Results
We were impressed by how significantly The Real Brokerage blew past analysts’ EPS expectations this quarter. We were also excited its EBITDA outperformed Wall Street’s estimates by a wide margin. Zooming out, we think this quarter featured some important positives. The stock traded up 4.9% to $4.68 immediately following the results.
The Real Brokerage may have had a good quarter, but does that mean you should invest right now? The latest quarter does matter, but not nearly as much as longer-term fundamentals and valuation, when deciding if the stock is a buy. We cover that in our actionable full research report which you can read here, it’s free.