
Television broadcasting and production company AMC Networks (NASDAQ: AMCX) fell short of the market’s revenue expectations in Q1 CY2025, with sales falling 6.9% year on year to $555.2 million. Its non-GAAP profit of $0.52 per share was 35.5% below analysts’ consensus estimates.
Is now the time to buy AMC Networks? Find out by accessing our full research report, it’s free.
AMC Networks (AMCX) Q1 CY2025 Highlights:
- Revenue: $555.2 million vs analyst estimates of $570.3 million (6.9% year-on-year decline, 2.6% miss)
- Adjusted EPS: $0.52 vs analyst expectations of $0.81 (35.5% miss)
- Adjusted EBITDA: $90.88 million vs analyst estimates of $100.9 million (16.4% margin, 9.9% miss)
- Operating Margin: 11.6%, down from 18.5% in the same quarter last year
- Free Cash Flow Margin: 17%, down from 24.2% in the same quarter last year
- Market Capitalization: $278 million
Chief Executive Officer Kristin Dolan said: "We continue to execute on our core strengths as we navigate the changing world of media. During the first quarter we delivered high-quality premium programming to our audiences, launched ad-supported AMC+ on Charter and generated $94 million of free cash flow.(1) We remain nimble and opportunistic in broadly distributing our sought-after content across all available platforms to build value for our partners, viewers and shareholders."
Company Overview
Originally the joint-venture of four cable television companies, AMC Networks (NASDAQ: AMCX) is a broadcaster producing a diverse range of television shows and movies.
Sales Growth
A company’s long-term sales performance is one signal of its overall quality. Any business can put up a good quarter or two, but many enduring ones grow for years. AMC Networks’s demand was weak over the last five years as its sales fell at a 4.6% annual rate. This wasn’t a great result and suggests it’s a low quality business.
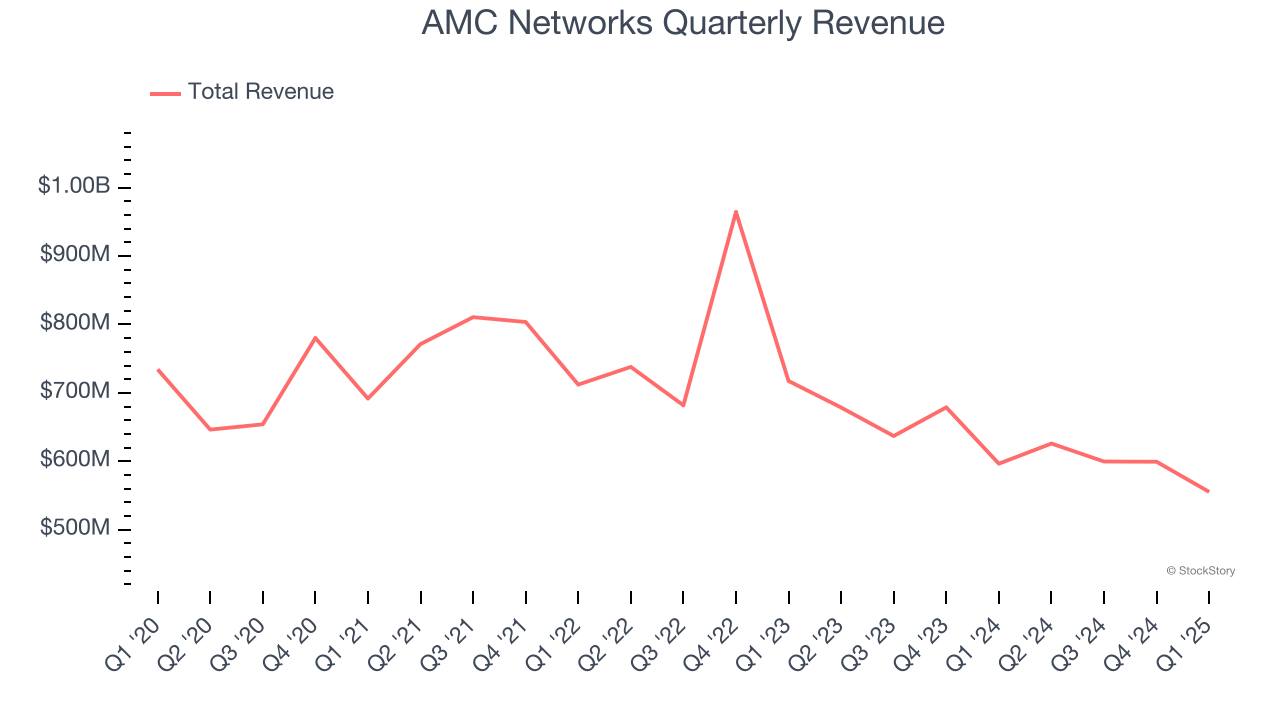
Long-term growth is the most important, but within consumer discretionary, product cycles are short and revenue can be hit-driven due to rapidly changing trends and consumer preferences. AMC Networks’s recent performance shows its demand remained suppressed as its revenue has declined by 12.4% annually over the last two years. 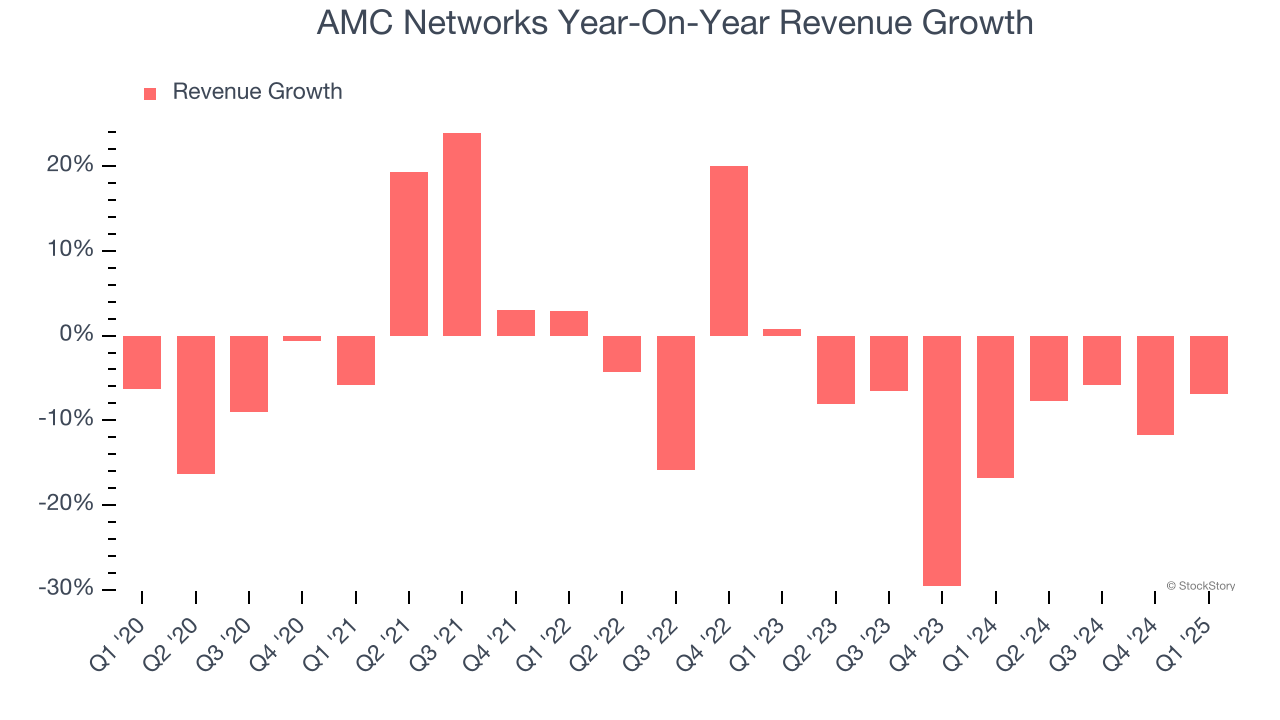
AMC Networks also breaks out the revenue for its most important segments, Affiliate and Advertising, which are 28.1% and 21.4% of revenue. Over the last two years, AMC Networks’s Affiliate revenue (retransmission and licensing fees) averaged 13.2% year-on-year declines while its Advertising revenue (marketing services) averaged 14.9% declines.
This quarter, AMC Networks missed Wall Street’s estimates and reported a rather uninspiring 6.9% year-on-year revenue decline, generating $555.2 million of revenue.
Looking ahead, sell-side analysts expect revenue to decline by 3.8% over the next 12 months. While this projection is better than its two-year trend, it's tough to feel optimistic about a company facing demand difficulties.
Here at StockStory, we certainly understand the potential of thematic investing. Diverse winners from Microsoft (MSFT) to Alphabet (GOOG), Coca-Cola (KO) to Monster Beverage (MNST) could all have been identified as promising growth stories with a megatrend driving the growth. So, in that spirit, we’ve identified a relatively under-the-radar profitable growth stock benefiting from the rise of AI, available to you FREE via this link.
Operating Margin
Operating margin is a key measure of profitability. Think of it as net income - the bottom line - excluding the impact of taxes and interest on debt, which are less connected to business fundamentals.
AMC Networks’s operating margin has been trending down over the last 12 months and averaged 4.8% over the last two years. The company’s profitability was mediocre for a consumer discretionary business and shows it couldn’t pass its higher operating expenses onto its customers.
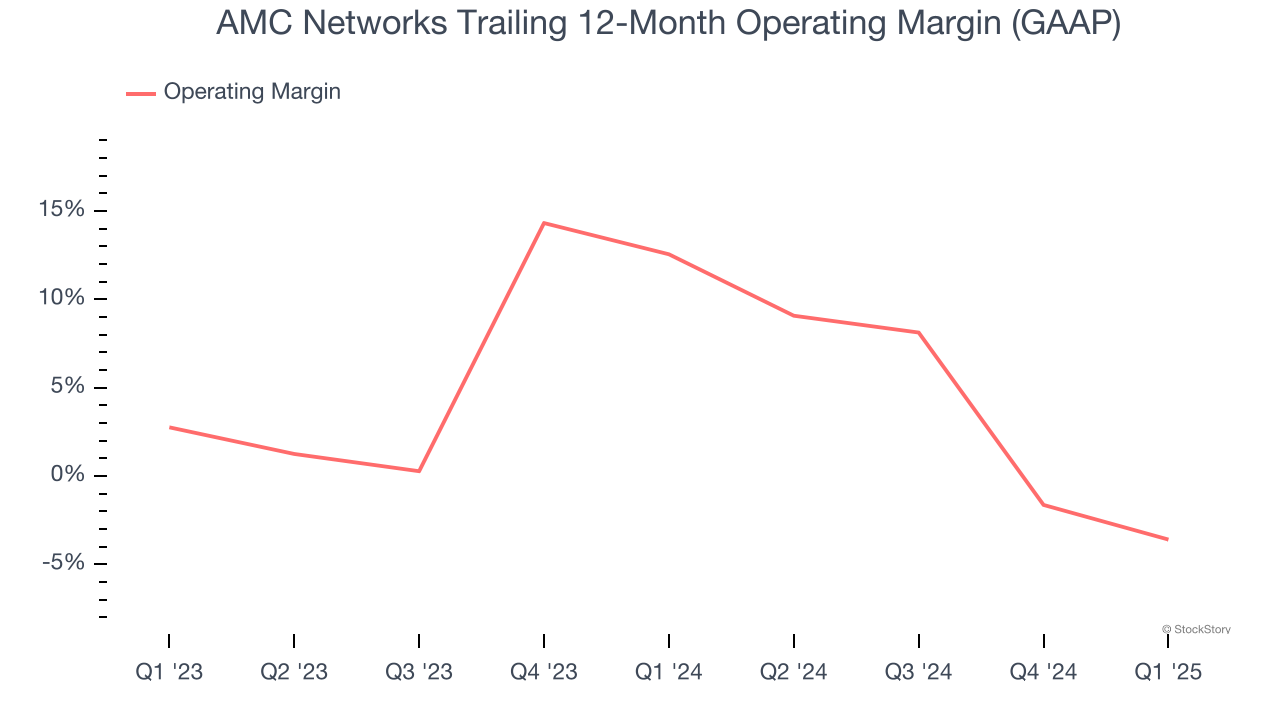
In Q1, AMC Networks generated an operating profit margin of 11.6%, down 6.9 percentage points year on year. This contraction shows it was less efficient because its expenses increased relative to its revenue.
Earnings Per Share
We track the long-term change in earnings per share (EPS) for the same reason as long-term revenue growth. Compared to revenue, however, EPS highlights whether a company’s growth is profitable.
Sadly for AMC Networks, its EPS declined by 15.3% annually over the last five years, more than its revenue. This tells us the company struggled because its fixed cost base made it difficult to adjust to shrinking demand.
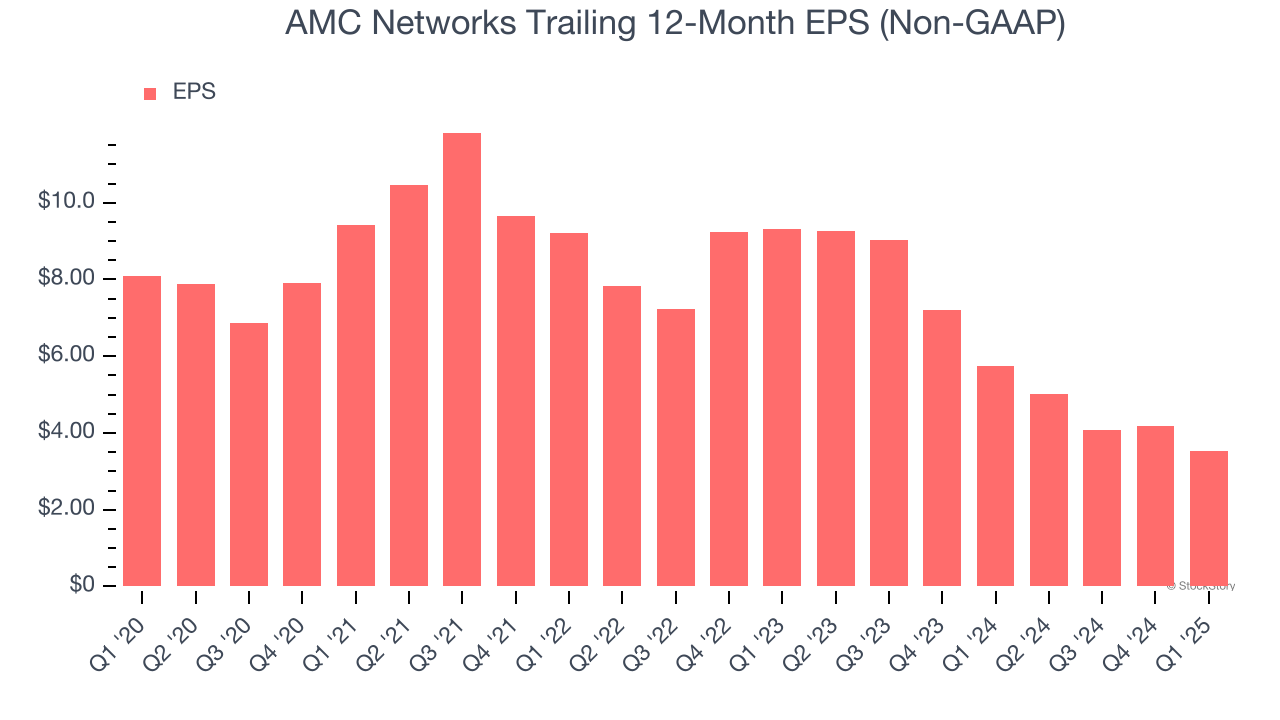
In Q1, AMC Networks reported EPS at $0.52, down from $1.16 in the same quarter last year. This print missed analysts’ estimates. Over the next 12 months, Wall Street expects AMC Networks’s full-year EPS of $3.54 to shrink by 13.3%.
Key Takeaways from AMC Networks’s Q1 Results
We struggled to find many positives in these results as its revenue, EPS, and EBITDA fell short of Wall Street’s estimates. Overall, this quarter could have been better. The stock remained flat at $6.19 immediately after reporting.
Big picture, is AMC Networks a buy here and now? What happened in the latest quarter matters, but not as much as longer-term business quality and valuation, when deciding whether to invest in this stock. We cover that in our actionable full research report which you can read here, it’s free.


