Over the past six months, Veralto’s shares (currently trading at $99.72) have posted a disappointing 6.3% loss while the S&P 500 was flat. This might have investors contemplating their next move.
Is now the time to buy Veralto, or should you be careful about including it in your portfolio? Dive into our full research report to see our analyst team’s opinion, it’s free.
Why Do We Think Veralto Will Underperform?
Even though the stock has become cheaper, we're swiping left on Veralto for now. Here are three reasons why we avoid VLTO and a stock we'd rather own.
1. Long-Term Revenue Growth Disappoints
A company’s long-term sales performance is one signal of its overall quality. Any business can experience short-term success, but top-performing ones enjoy sustained growth for years. Regrettably, Veralto’s sales grew at a sluggish 3.8% compounded annual growth rate over the last three years. This fell short of our benchmark for the industrials sector. 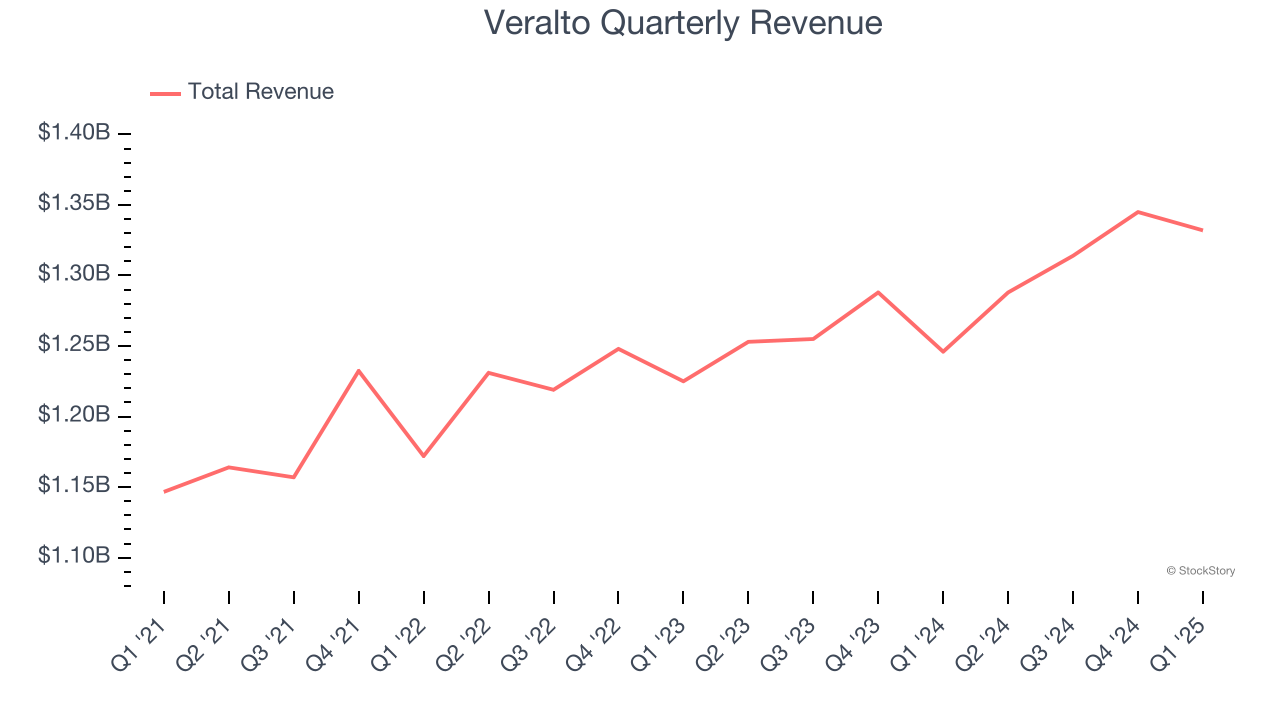
2. Projected Revenue Growth Is Slim
Forecasted revenues by Wall Street analysts signal a company’s potential. Predictions may not always be accurate, but accelerating growth typically boosts valuation multiples and stock prices while slowing growth does the opposite.
Over the next 12 months, sell-side analysts expect Veralto’s revenue to rise by 3.3%, close to its 3.8% annualized growth for the past three years. This projection is underwhelming and suggests its newer products and services will not lead to better top-line performance yet.
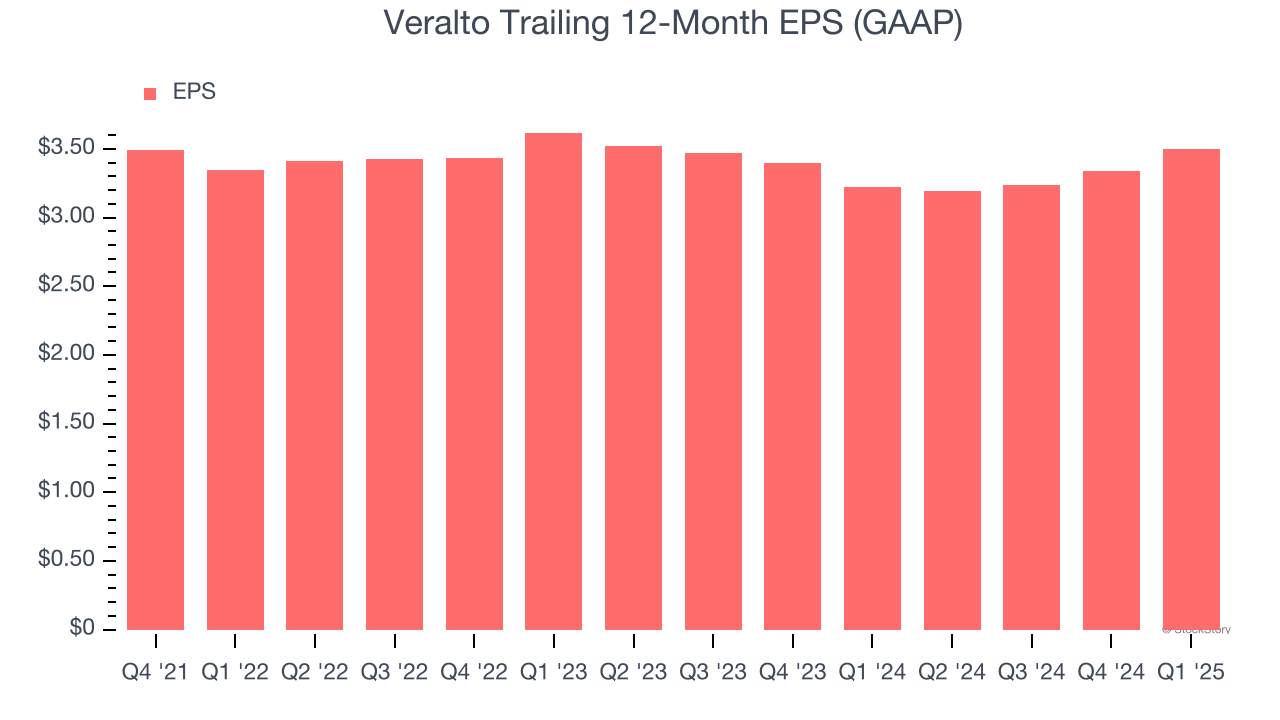
3. EPS Barely Growing
We track the change in earnings per share (EPS) because it highlights whether a company’s growth is profitable.
Veralto’s EPS grew at a weak 1.5% compounded annual growth rate over the last three years, lower than its 3.8% annualized revenue growth. This tells us the company became less profitable on a per-share basis as it expanded.
Final Judgment
Veralto falls short of our quality standards. Following the recent decline, the stock trades at 26.8× forward P/E (or $99.72 per share). This valuation tells us a lot of optimism is priced in - you can find better investment opportunities elsewhere. We’d suggest looking at one of our top digital advertising picks.
Stocks We Like More Than Veralto
Donald Trump’s victory in the 2024 U.S. Presidential Election sent major indices to all-time highs, but stocks have retraced as investors debate the health of the economy and the potential impact of tariffs.
While this leaves much uncertainty around 2025, a few companies are poised for long-term gains regardless of the political or macroeconomic climate, like our Top 5 Growth Stocks for this month. This is a curated list of our High Quality stocks that have generated a market-beating return of 183% over the last five years (as of March 31st 2025).
Stocks that made our list in 2020 include now familiar names such as Nvidia (+1,545% between March 2020 and March 2025) as well as under-the-radar businesses like the once-small-cap company Exlservice (+354% five-year return). Find your next big winner with StockStory today.