
Fashion conglomerate Oxford Industries (NYSE: OXM) reported Q1 CY2025 results topping the market’s revenue expectations, but sales fell by 1.3% year on year to $392.9 million. Revenue guidance for the full year exceeded analysts’ estimates, but next quarter’s guidance of $405 million was less impressive, coming in 1.1% below expectations. Its non-GAAP profit of $1.82 per share was in line with analysts’ consensus estimates.
Is now the time to buy Oxford Industries? Find out by accessing our full research report, it’s free.
Oxford Industries (OXM) Q1 CY2025 Highlights:
- Revenue: $392.9 million vs analyst estimates of $384.8 million (1.3% year-on-year decline, 2.1% beat)
- Adjusted EPS: $1.82 vs analyst estimates of $1.82 (in line)
- The company dropped its revenue guidance for the full year to $1.50 billion at the midpoint from $1.51 billion, a 1% decrease
- Management lowered its full-year Adjusted EPS guidance to $3 at the midpoint, a 37.5% decrease
- Operating Margin: 9.2%, down from 13.2% in the same quarter last year
- Free Cash Flow was -$27.37 million, down from $21.03 million in the same quarter last year
- Market Capitalization: $814.2 million
Tom Chubb, Chairman and CEO, commented, “We were able to deliver sales and adjusted EPS within our guidance ranges for the first quarter despite uncertain tariff and trade dynamics that are significantly impacting our industry and operating landscape. Despite the increasing headwinds, we were led by a low double digit increase at Lilly Pulitzer as the brand’s current assortment is resonating strongly with its core consumer, and overall sales were only modestly lower than last year. At the same time, we were able to maintain strong gross margins above 64%."
Company Overview
The parent company of Tommy Bahama, Oxford Industries (NYSE: OXM) is a lifestyle fashion conglomerate with brands that embody outdoor happiness.
Sales Growth
A company’s long-term sales performance is one signal of its overall quality. Any business can put up a good quarter or two, but the best consistently grow over the long haul. Regrettably, Oxford Industries’s sales grew at a sluggish 8.6% compounded annual growth rate over the last five years. This was below our standard for the consumer discretionary sector and is a rough starting point for our analysis.
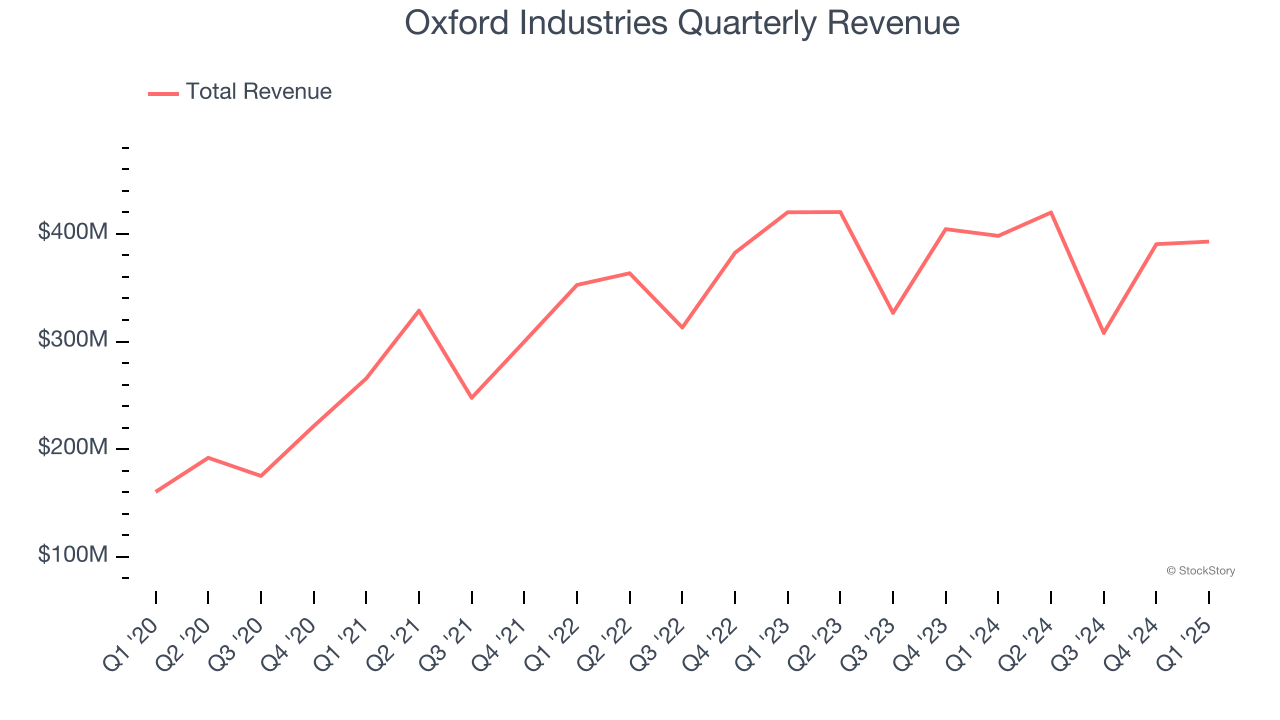
Long-term growth is the most important, but within consumer discretionary, product cycles are short and revenue can be hit-driven due to rapidly changing trends and consumer preferences. Oxford Industries’s recent performance shows its demand has slowed as its annualized revenue growth of 1.1% over the last two years was below its five-year trend. 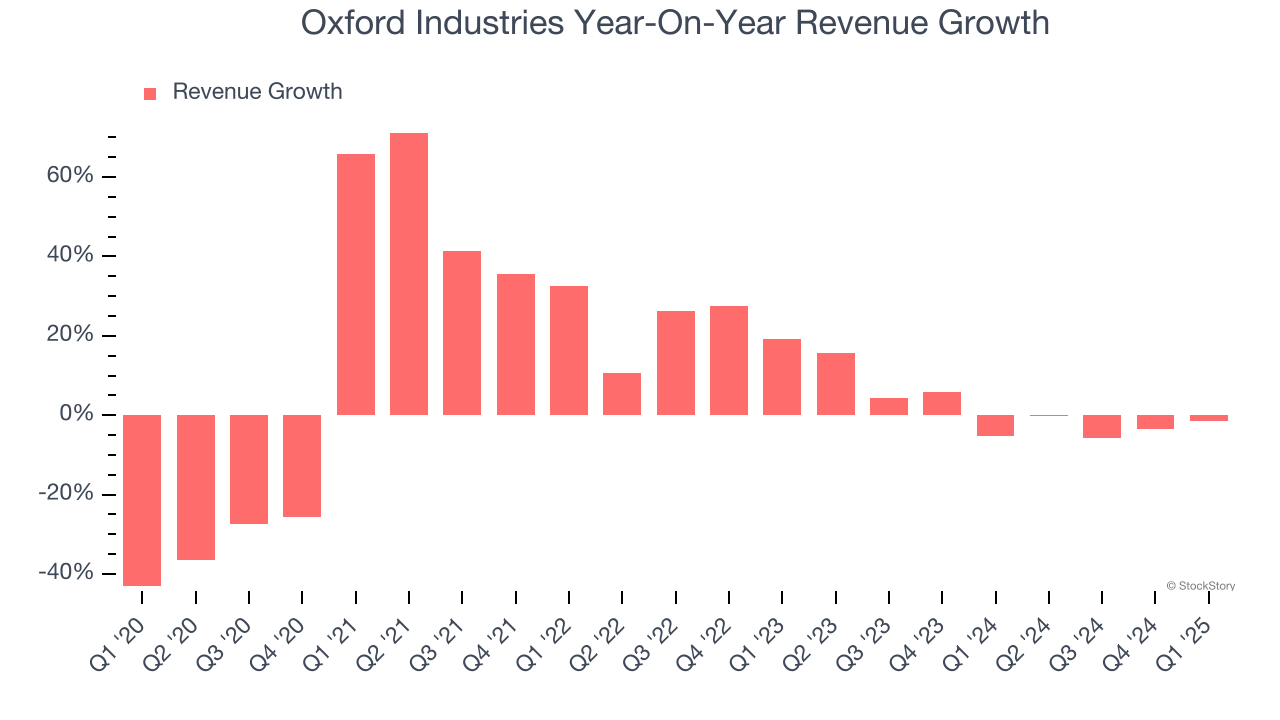
This quarter, Oxford Industries’s revenue fell by 1.3% year on year to $392.9 million but beat Wall Street’s estimates by 2.1%. Company management is currently guiding for a 3.5% year-on-year decline in sales next quarter.
Looking further ahead, sell-side analysts expect revenue to remain flat over the next 12 months, a slight deceleration versus the last two years. This projection doesn't excite us and suggests its products and services will see some demand headwinds.
Here at StockStory, we certainly understand the potential of thematic investing. Diverse winners from Microsoft (MSFT) to Alphabet (GOOG), Coca-Cola (KO) to Monster Beverage (MNST) could all have been identified as promising growth stories with a megatrend driving the growth. So, in that spirit, we’ve identified a relatively under-the-radar profitable growth stock benefiting from the rise of AI, available to you FREE via this link.
Operating Margin
Oxford Industries’s operating margin has been trending up over the last 12 months and averaged 5.1% over the last two years. The company’s higher efficiency is a breath of fresh air, but its suboptimal cost structure means it still sports lousy profitability for a consumer discretionary business.
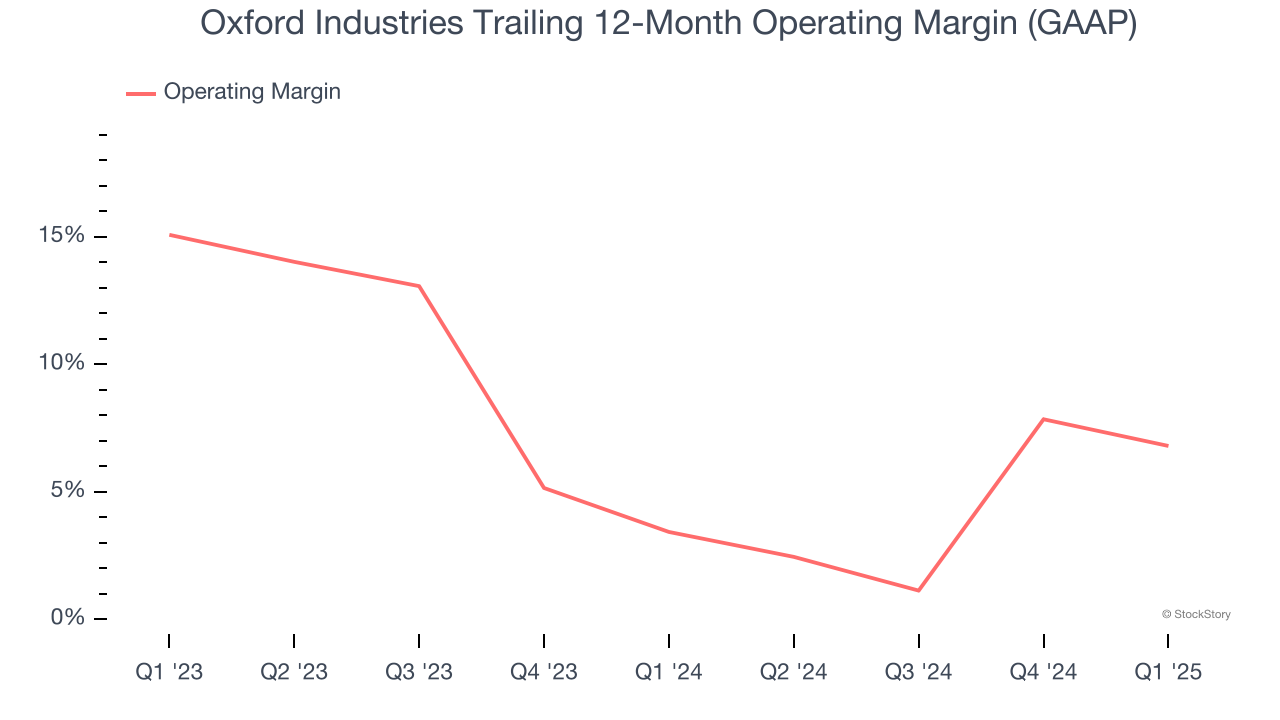
This quarter, Oxford Industries generated an operating margin profit margin of 9.2%, down 4 percentage points year on year. This contraction shows it was less efficient because its expenses increased relative to its revenue.
Earnings Per Share
Revenue trends explain a company’s historical growth, but the long-term change in earnings per share (EPS) points to the profitability of that growth – for example, a company could inflate its sales through excessive spending on advertising and promotions.
Oxford Industries’s EPS grew at an astounding 25.1% compounded annual growth rate over the last five years, higher than its 8.6% annualized revenue growth. This tells us the company became more profitable on a per-share basis as it expanded.
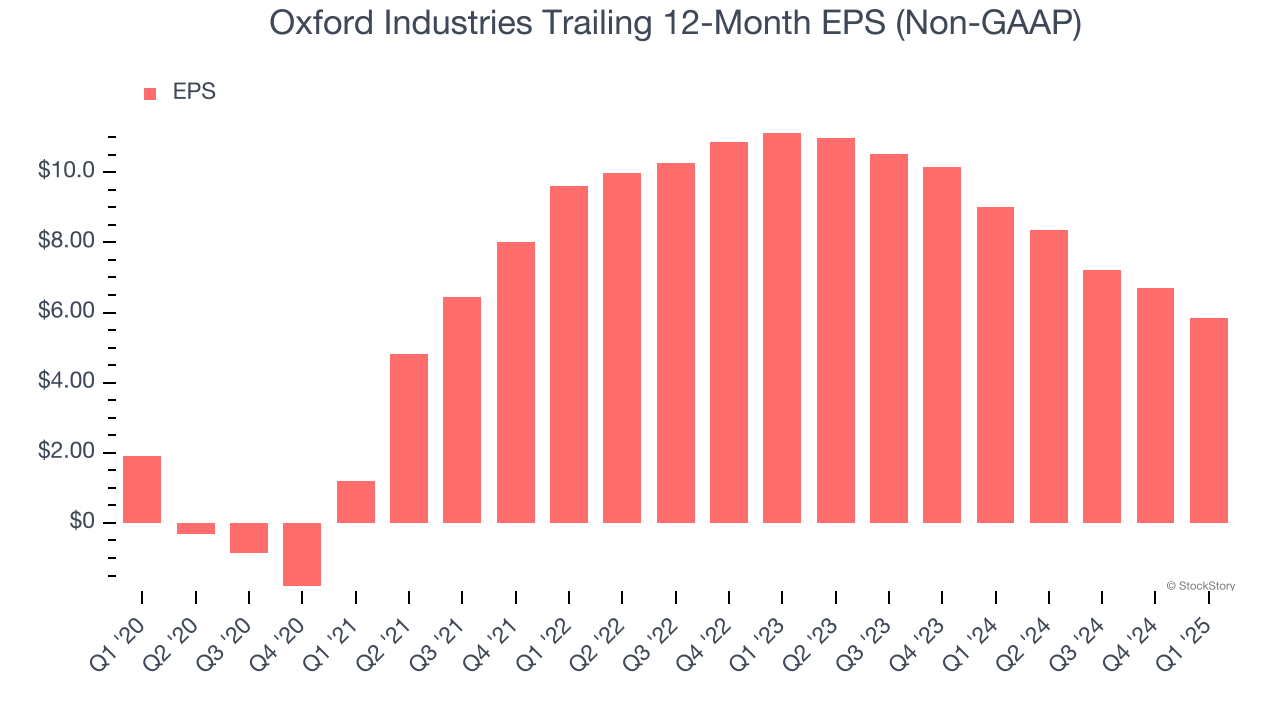
In Q1, Oxford Industries reported EPS at $1.82, down from $2.66 in the same quarter last year. This print was close to analysts’ estimates. Over the next 12 months, Wall Street expects Oxford Industries’s full-year EPS of $5.85 to shrink by 22.5%.
Key Takeaways from Oxford Industries’s Q1 Results
It was encouraging to see Oxford Industries beat analysts’ revenue expectations this quarter. On the other hand, it lowered its full-year revenue and EPS guidance. Overall, this quarter could have been better. The stock traded down 9.1% to $45.49 immediately after reporting.
Oxford Industries didn’t show it’s best hand this quarter, but does that create an opportunity to buy the stock right now? The latest quarter does matter, but not nearly as much as longer-term fundamentals and valuation, when deciding if the stock is a buy. We cover that in our actionable full research report which you can read here, it’s free.


