
Since December 2024, Match Group has been in a holding pattern, posting a small return of 2.4% while floating around $31.31.
Given the underwhelming price action, is now a good time to buy MTCH? Or should investors expect a bumpy road ahead? Find out in our full research report, it’s free.
Why Does MTCH Stock Spark Debate?
Originally started as a dial-up service before widespread internet adoption, Match (NASDAQ: MTCH) was an early innovator in online dating and today has a portfolio of apps including Tinder, Hinge, Archer, and OkCupid.
Two Positive Attributes:
1. Eye-Popping Growth in Customer Spending
Average revenue per user (ARPU) is a critical metric to track because it measures how much the average user spends. ARPU is also a key indicator of how valuable its users are (and can be over time).
Match Group’s ARPU growth has been excellent over the last two years, averaging 9.5%. Although its payers shrank during this time, the company’s ability to successfully increase monetization demonstrates its platform’s value for existing users. 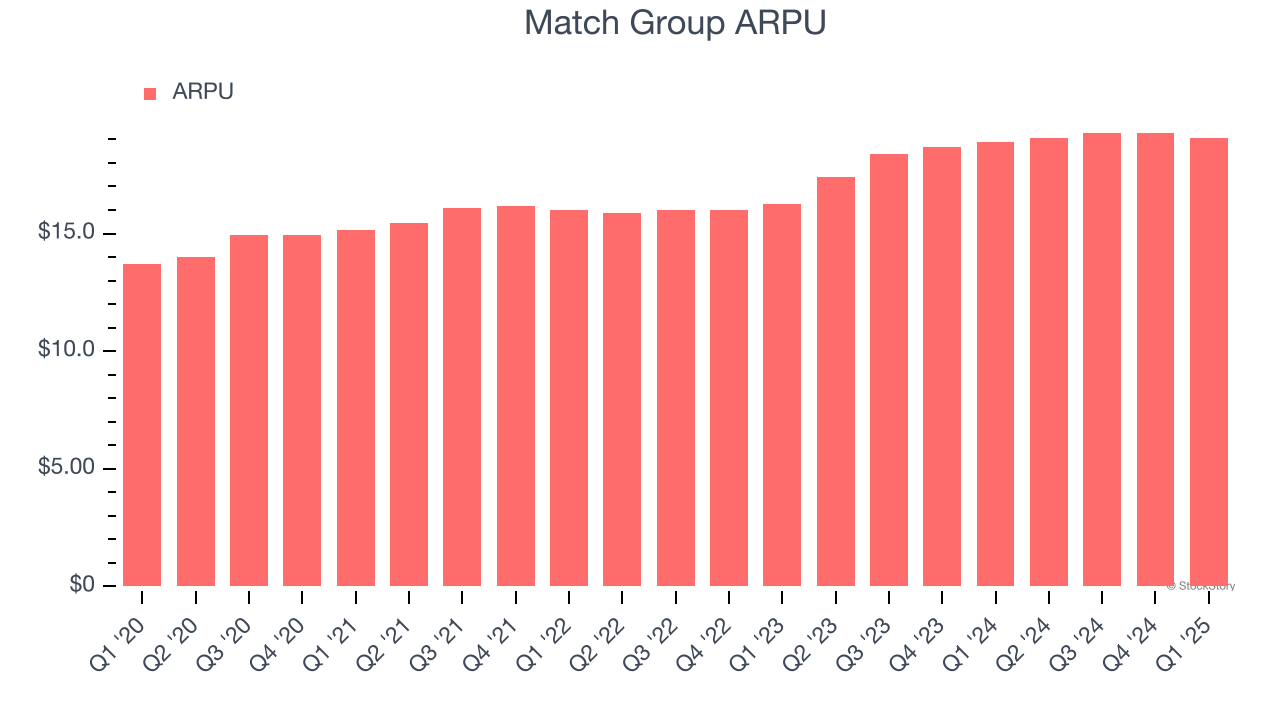
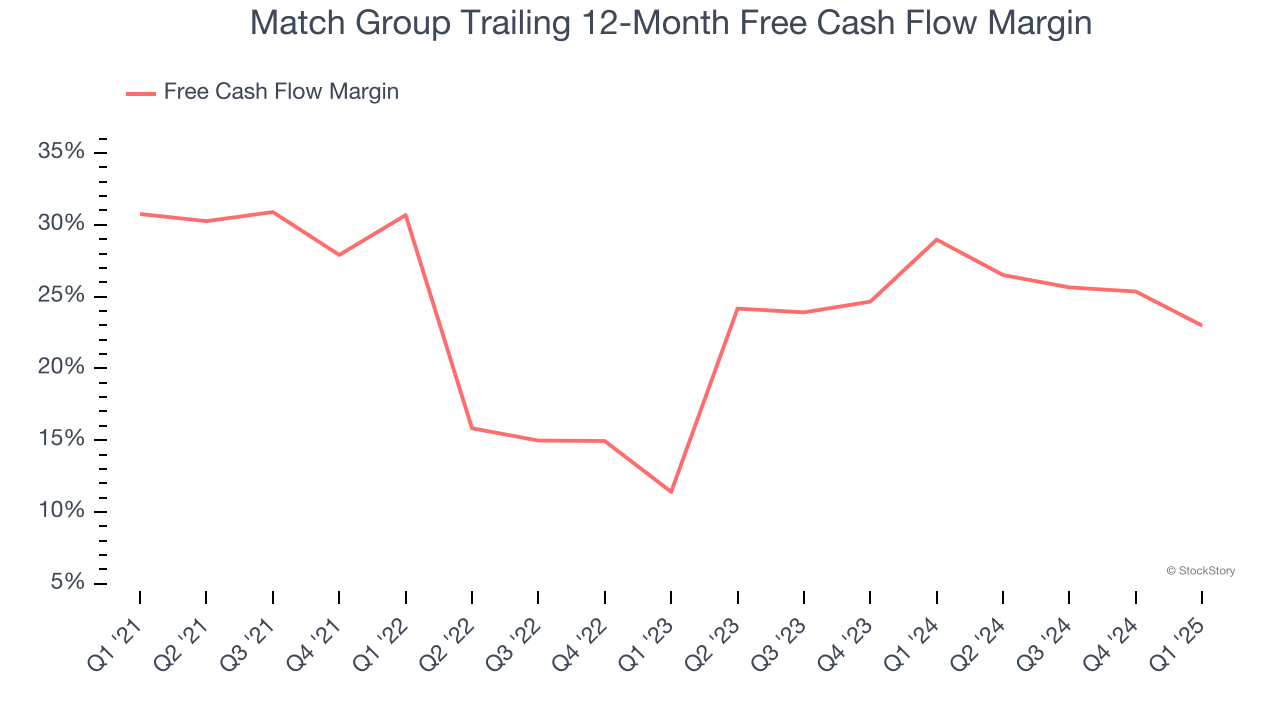
2. Excellent Free Cash Flow Margin Boosts Reinvestment Potential
Free cash flow isn't a prominently featured metric in company financials and earnings releases, but we think it's telling because it accounts for all operating and capital expenses, making it tough to manipulate. Cash is king.
Match Group has shown terrific cash profitability, driven by its lucrative business model and cost-effective customer acquisition strategy that enable it to stay ahead of the competition through investments in new products rather than sales and marketing. The company’s free cash flow margin was among the best in the consumer internet sector, averaging 26% over the last two years.
One Reason to be Careful:
Declining Payers Reflect Product Weakness
As a subscription-based app, Match Group generates revenue growth by expanding both its subscriber base and the amount each subscriber spends over time.
Match Group struggled with new customer acquisition over the last two years as its payers have declined by 4.8% annually to 14.2 million in the latest quarter. This performance isn't ideal because internet usage is secular, meaning there are typically unaddressed market opportunities. If Match Group wants to accelerate growth, it likely needs to enhance the appeal of its current offerings or innovate with new products. 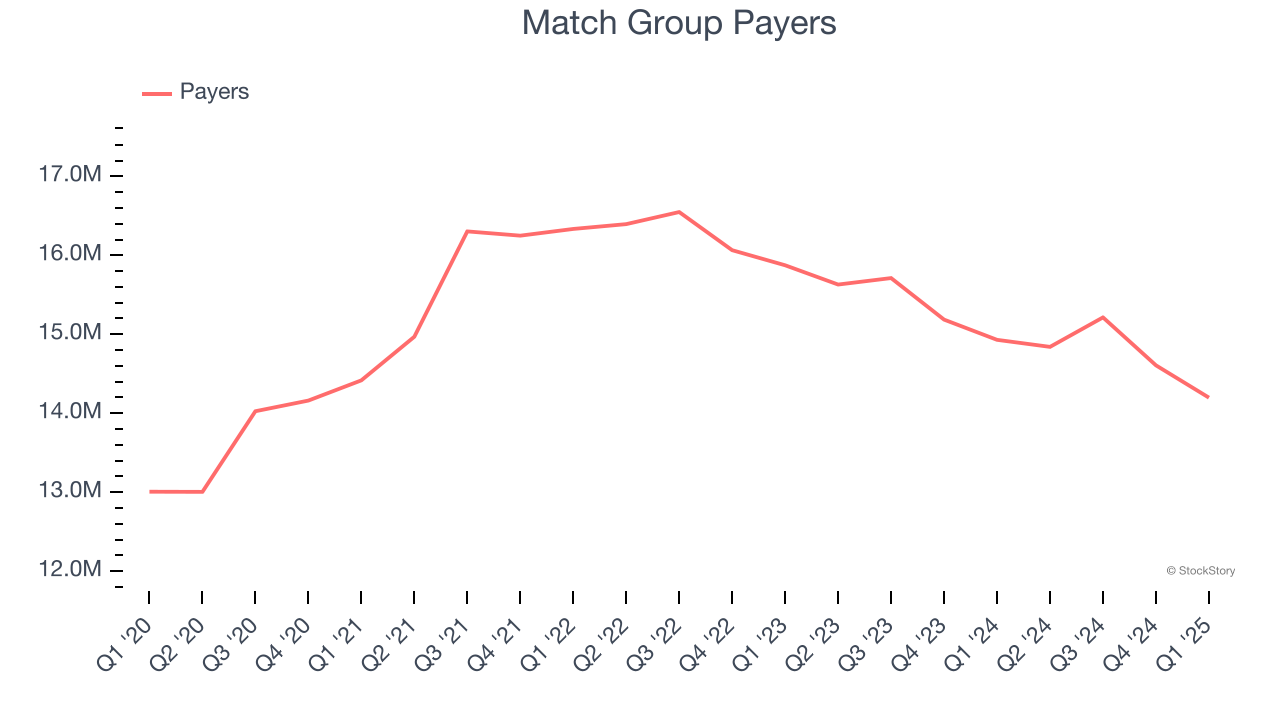
Final Judgment
Match Group has huge potential even though it has some open questions, but at $31.31 per share (or 6.7× forward EV/EBITDA), is now the right time to buy the stock? See for yourself in our comprehensive research report, it’s free.
Stocks We Like Even More Than Match Group
Donald Trump’s victory in the 2024 U.S. Presidential Election sent major indices to all-time highs, but stocks have retraced as investors debate the health of the economy and the potential impact of tariffs.
While this leaves much uncertainty around 2025, a few companies are poised for long-term gains regardless of the political or macroeconomic climate, like our Top 5 Growth Stocks for this month. This is a curated list of our High Quality stocks that have generated a market-beating return of 183% over the last five years (as of March 31st 2025).
Stocks that made our list in 2020 include now familiar names such as Nvidia (+1,545% between March 2020 and March 2025) as well as under-the-radar businesses like the once-small-cap company Comfort Systems (+782% five-year return). Find your next big winner with StockStory today.